Orthomosaic maps are created by stitching aerial images into a single, accurate, high-resolution map. The key to producing these maps lies in proper image overlap, which ensures smooth integration and precise results. Here's what you need to know:
- Front Overlap: Images along the flight path should overlap by 70–80%. For complex areas, increase to 85%.
- Side Overlap: Adjacent flight paths should overlap by 60–70%. Adjust to 75–80% for urban or dense terrains.
- Altitude: Typically, drones fly at 200 feet above ground, balancing coverage and detail.
- Flight Speed: Maintain 15–25 mph to avoid gaps or motion blur.
- Ground Control Points (GCPs): Use GPS-marked points to improve accuracy, achieving sub-inch precision when placed strategically.
- Terrain and Weather: Adjust overlap and altitude for elevation changes, shadows, or windy conditions.
Proper overlap ensures accurate stitching, reduces errors, and improves 3D measurements. Tools like photogrammetry software and platforms like Anvil Labs help process and manage large orthomosaic files efficiently. By planning overlap carefully, you save time, avoid re-flights, and produce reliable maps for industrial and construction projects.
Understanding Overlaps in Drone Mapping
Image Overlap Basics
Grasping the concept of image overlap is key to producing accurate orthomosaic maps. Proper overlap ensures smoother data processing and reliable results. By planning for sufficient overlap, you guarantee that each ground point appears in multiple images - critical for accurate 3D measurements.
Front and Side Overlap Explained
Front overlap is the shared area between consecutive images along your drone's flight path. Maintaining a high front overlap ensures enough common content for accurate stitching.
Side overlap, also called lateral overlap, refers to the intersecting areas between images captured on adjacent flight paths. The ideal side overlap varies based on your project's needs and the terrain's complexity.
While increasing overlap may mean capturing more images - leading to longer flight times and higher data storage demands - the boost in map accuracy often makes it worthwhile.
Why Proper Overlap Matters
Adequate overlap enhances map quality by increasing tie points, smoothing transitions, correcting lens distortions, and improving 3D measurements. This redundancy also acts as a safety net; if one image suffers from motion blur or poor lighting, overlapping images can fill in the gaps, ensuring complete coverage.
Planning with Measurement Units
In the U.S., planning image overlap involves using both imperial and metric units, depending on your equipment and project requirements. For altitude, operators often work in feet above ground level (AGL), aiming for a balance between ground coverage and the desired detail level. The ground sample distance (GSD) - commonly measured in inches per pixel - determines the detail captured in your orthomosaic.
For large sites, measurements are typically in acres, while smaller areas are measured in square feet. On expansive projects, your overlap strategy directly influences the total number of images needed. Factors like flight altitude and camera specs play a big role in determining your approach to flight paths and image capture.
How to Plan Image Overlap
Planning image overlap carefully is crucial to creating accurate orthomosaic maps. Follow these steps to ensure your overlap strategy delivers precise results.
Define Your Mapping Area
Start by outlining the boundaries of your project using GPS coordinates or visible landmarks. Include a buffer zone of 50–100 feet around restricted areas to avoid potential issues.
Next, calculate the total area of your site. For large locations, like a 500-acre industrial facility, you'll need a more detailed flight plan compared to a smaller 2-acre construction site. Larger areas require careful planning to maintain consistent image overlap throughout the site.
Be mindful of restricted zones within the mapping area. For instance, power lines, active construction sites, or sensitive equipment might require you to adjust flight paths. Highlight these zones on your planning map and tweak your overlap strategy as needed. In areas with complex structures, increasing overlap percentages can help compensate for limited flight options.
Also, take note of elevation changes. A difference of 200 feet in elevation may require you to adjust flight altitude to maintain consistent image quality. Use topographic maps or previous survey data to identify hills, valleys, or steep grade changes that might affect your overlap plan.
Once you've defined the boundaries and accounted for elevation, you can move on to planning flight paths and altitude.
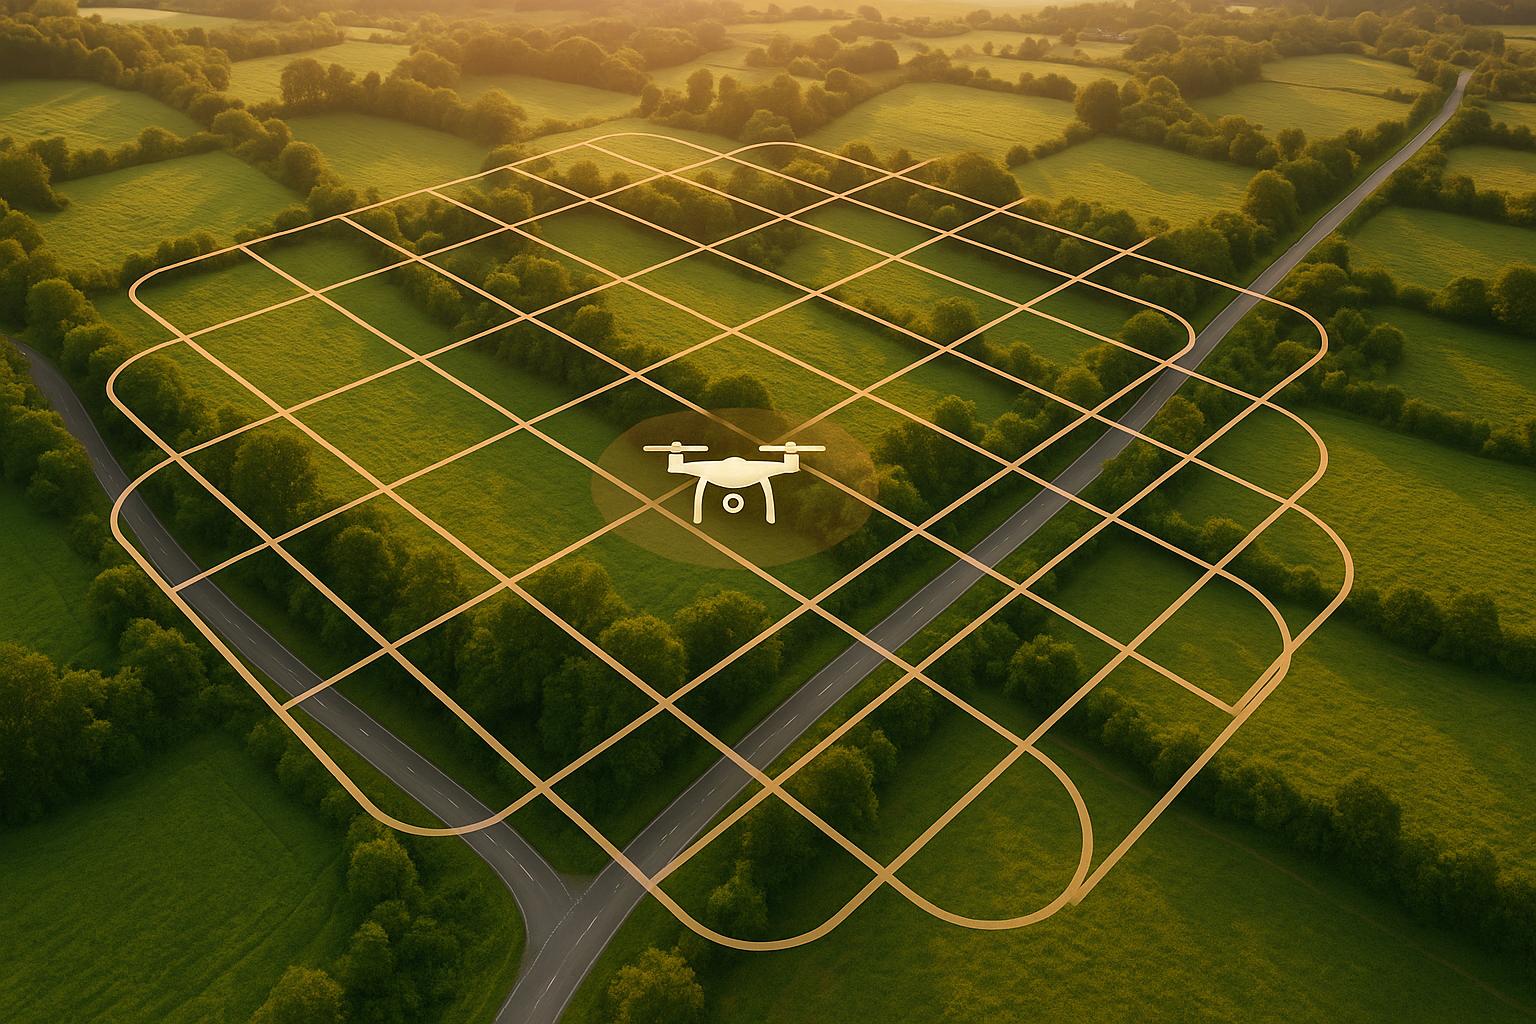
Set Flight Paths and Altitude
For flat terrain, a standard grid flight path works well. For more complex areas, like those with uneven terrain or tall structures, a cross-hatch pattern is better, though it can double your flight time.
Set your front overlap to 70–80% and side overlap to 60–70% for most industrial sites. If you're mapping areas with tall buildings, dense vegetation, or critical infrastructure, increase these to 85% front and 75% side overlap to ensure higher accuracy.
Flying at 200 feet above ground level (AGL) typically provides a ground sample distance of 1–2 inches per pixel with standard drone cameras. Lower altitudes capture finer details but require more images and extend flight time. Higher altitudes cover more ground per image but might miss smaller features or defects.
Keep your flight speed between 15–25 mph to maintain proper overlap. Flying too fast risks leaving gaps in your coverage, while flying too slow can strain battery life and extend the project timeline.
Adjust for Terrain and Weather
Once you've set your flight paths and altitude, fine-tune your strategy to account for terrain and weather conditions.
For flat terrain, you can stick to your planned altitude and overlap settings. This works well for large, open areas like parking lots or storage facilities.
In urban areas with tall structures, increase overlap by 10–15%. Use 85% front and 80% side overlap in heavily vegetated zones where shadows and dense canopies can obscure ground features. These adjustments help ensure complete and accurate mapping despite challenges like varying perspectives or limited visibility.
Weather also plays a role. Bright sunlight, overcast skies, high winds (above 15 mph), or seasonal extremes may require you to increase overlap by 5–15%. These tweaks help counteract issues like shadows, motion blur, or other environmental factors that can affect image quality.
Overlap for Different Project Types
When it comes to mapping projects, fine-tuning image overlap based on the project type is key to achieving accurate results. Factors like the terrain's complexity, the presence of structures, and the overall site size all play a role in determining how much overlap is ideal.
Flat vs. Complex Terrain
Flat areas, such as parking lots or agricultural fields, typically require 60–70% overlap. These environments are straightforward, with minimal elevation changes or obstructions, making it easier for photogrammetry software to align and stitch images without issues.
On the other hand, regions with uneven terrain - like hilly landscapes, dense forests, or mixed topography - benefit from higher overlap levels. This extra redundancy ensures that enough detail is captured and helps address challenges like shadows or objects blocking the view. For such complex areas, sticking to the minimum overlap isn't enough; additional coverage is crucial.
Urban Areas and Tall Structures
Urban settings and locations featuring tall buildings come with their own set of challenges. A standard grid flight pattern might not capture all the necessary angles in these environments. Here, using a cross-hatch flight pattern can improve the baseline 60–70% overlap by adding oblique angles. This approach helps minimize shadows and blind spots, ensuring a more comprehensive capture of the area.
Small vs. Large Project Sites
The size of the project site also impacts overlap requirements. For smaller sites, the standard 60–70% overlap generally works well. However, larger sites often demand more nuanced adjustments. Longer flight times and varying conditions across a large area can affect data quality, so increasing overlap and segmenting the site into smaller sections can be helpful. By planning overlap between these segments, you can ensure seamless integration of the final orthomosaic while also making data processing more manageable.
sbb-itb-ac6e058
Processing Data and Quality Control
After your drone flight, the real work begins: processing all that captured data. This is where your planned overlap strategy pays off, as hundreds or even thousands of individual images are transformed into a single, accurate orthomosaic map. The quality of your final output depends heavily on the overlap planned during the flight and how well you manage the processing workflow. Let’s break down how overlap directly impacts each stage of data processing.
Post-Flight Data Processing
The first step is importing your images into photogrammetry software such as Pix4D, Agisoft Metashape, or DroneDeploy. These programs use the GPS coordinates and camera settings embedded in the image metadata to analyze and align the photos. By identifying shared features in overlapping images, the software generates thousands of tie points and creates a dense point cloud, which forms the foundation for 3D mapping. More overlap means more tie points, which improves alignment and overall accuracy.
Once the tie points are established, the software moves on to mesh generation, texture mapping, and orthorectification. Orthorectification removes perspective distortions, producing a geometrically accurate orthomosaic map. Depending on the size of your project, this entire process can take anywhere from 30 minutes for a small site to several hours for a large industrial area.
Using Ground Control Points
Ground Control Points (GCPs) are essential for achieving high positional accuracy in your orthomosaic. These are physical markers placed across your mapping area before the flight, with their precise coordinates measured using high-accuracy GPS equipment. During data processing, you manually identify these markers in your images and input their known coordinates into the software.
Strategic placement of GCPs is critical. For most projects, placing 3-5 GCPs around the edges of the site and 1-2 in the center works well. Each GCP should appear in multiple overlapping images - ideally, at least 5-10 photos should capture each marker.
The difference GCPs make is striking. Without them, consumer drones typically achieve horizontal accuracy within 3 to 16 feet. With properly surveyed GCPs, you can often achieve sub-inch accuracy, which is crucial for tasks like maintenance planning, volume calculations, or compliance reporting in industrial settings.
How Overlap Affects Processing
Overlap levels play a huge role in determining the efficiency and precision of your mapping project. Alongside GCP placement, overlap directly impacts the software’s ability to align images and create a seamless orthomosaic. Higher overlap percentages improve alignment accuracy by generating more tie points and reducing gaps in coverage. However, this comes with trade-offs: longer processing times and larger file sizes.
Interestingly, the relationship between overlap and processing time isn’t linear. For example, increasing overlap from 60% to 80% can double the processing time while offering only minor accuracy improvements for flat, simple terrain. On the other hand, for industrial sites with complex structures and varying elevations, higher overlap can prevent reconstruction errors that might otherwise require costly re-flights.
Data volume is another key consideration. A project with 70% overlap might generate 2,000 images, while increasing overlap to 85% could produce 3,500 or more. This not only affects processing time but also requires more storage space and computational power. In many cases, dividing large sites into smaller sections with moderate overlap strikes the best balance between quality and efficiency.
Proper overlap doesn’t just ensure complete coverage - it also helps the software manage tricky conditions. Shadows from tall structures, reflective surfaces on metal buildings, or repetitive textures that confuse feature-matching algorithms are all easier to handle with sufficient overlap. These improvements are especially valuable when precise measurements or detailed annotations are needed for asset management and other critical tasks.
Managing Orthomosaic Data with Anvil Labs
Once your orthomosaic data has been processed, the next challenge is managing and sharing it effectively. These files are often massive - sometimes several gigabytes - making traditional file-sharing methods inconvenient. That’s where Anvil Labs steps in, offering a streamlined solution for hosting, processing, and sharing large datasets. By efficiently managing your orthomosaic files, you can fully capitalize on the effort you put into creating them.
Anvil Labs Features for Orthomosaics
Anvil Labs provides a platform specifically designed for hosting and managing orthomosaic data alongside other spatial information. Its robust hosting capabilities eliminate the hassle of server management and file size limitations, while ensuring accessibility across devices - whether you’re in the office or out in the field.
The platform also includes annotation and measurement tools, allowing users to make direct markups on the orthomosaic for a more interactive analysis. Customizable viewing options let you fine-tune how data is displayed, such as overlaying different datasets or comparing maps from different time periods. This flexibility is especially useful for tracking changes and understanding evolving site conditions.
For teams that prefer to offload the technical side of map creation, Anvil Labs offers automated data processing services at a cost of $3 per gigapixel. They handle everything from stitching and post-processing to producing detailed maps, Digital Surface Models, 3D renderings, and even 3D-printed models. Final outputs are delivered as digital files in your preferred formats.
Benefits for Industrial Use
When working with sensitive site information, secure sharing with strict access controls is critical. Anvil Labs offers robust security features to ensure that only authorized personnel can view or interact with proprietary data, making it ideal for projects involving regulatory compliance or proprietary equipment.
The platform also excels at integrating orthomosaic data with other spatial datasets. For example, you can combine your maps with thermal imagery to pinpoint equipment hot spots, overlay LiDAR point clouds for detailed elevation insights, or incorporate 360° panoramas to provide ground-level context. This ability to consolidate multiple data types simplifies workflows and enhances project management for industrial sites.
Pricing is designed to meet various project needs. The Project Hosting plan, priced at $49 per project, is perfect for smaller, one-time mapping efforts. For ongoing site management and team collaboration, the Asset Viewer plan is available for $99 per month, offering advanced tools and continuous access.
For construction and infrastructure projects, Anvil Labs serves as a central hub for managing documentation. With secure hosting, annotation tools, and cross-device access, it supports tasks like progress tracking, compliance reporting, and stakeholder communication. Plus, the platform preserves both current and historical mapping data, ensuring you have a comprehensive archive for future analysis.
Conclusion
Getting the image overlap right is key to creating successful orthomosaic maps. Sticking to a 70% front and 60% side overlap ensures accurate results, while insufficient coverage could lead to frustrating and expensive re-flights. When construction teams use these overlap guidelines, they can produce maps precise enough to align with site plans and catch potential deviations early on.
Well-planned overlap not only boosts map accuracy but also makes post-processing much smoother. These benefits support more reliable and efficient project management.
In industrial settings, the stakes are even higher. Careful planning allows teams to track progress frequently and spot issues before they escalate, saving both time and money. Accurate orthomosaic maps also make it easier to overlay utility plans and design specifications, streamlining project workflows.
Managing the large, multi-gigabyte files that come with orthomosaic projects can be a challenge, but Anvil Labs offers a solution. Their platform provides tools for hosting, processing, and securely sharing orthomosaic data and other spatial information. With features like cross-device access, annotation tools, and secure sharing, Anvil Labs ensures that the effort put into proper overlap planning translates into actionable insights for managing industrial sites effectively.
FAQs
What happens if image overlap isn’t properly planned in orthomosaic mapping?
When planning orthomosaic mapping, neglecting to account for adequate image overlap can seriously impact the quality and accuracy of your results. Common problems include blurry or distorted visuals, incorrect measurements, and noticeable gaps in the final map.
Ensuring sufficient overlap between images is key to achieving smooth stitching, precise 3D reconstructions, and dependable data for analysis. Without proper overlap, important details might be lost, potentially leading to mistakes in decisions or project implementation.
How do Ground Control Points (GCPs) improve orthomosaic map accuracy, and where should they be placed?
Ground Control Points (GCPs) play a crucial role in enhancing the accuracy of orthomosaic maps by linking aerial images to exact ground positions. This connection helps reduce positional errors and ensures dependable measurements, which is especially important for larger or more intricate project areas.
For optimal results, GCPs should be spaced evenly throughout the mapping area, with extra focus on edges, corners, and areas with notable elevation changes. Careful placement and sufficient coverage are essential for producing high-accuracy orthomosaics, particularly when dealing with uneven terrains or expansive projects.
How do weather conditions impact drone flights for orthomosaic mapping?
Weather plays a huge role in drone flights and the accuracy of orthomosaic maps. Strong winds can make it hard for drones to stay steady, leading to gaps or distortions in the images you capture. Rain or moisture isn’t just a risk to your equipment - it can also blur images, even if your drone is built to handle tough conditions. And when it comes to fog, clouds, or heavy precipitation, these can seriously limit visibility, making it unsafe to fly and harder to gather reliable data.
To get the best results, always check the weather forecast before heading out. Avoid flying in conditions that might put your drone - or your data - at risk.
