Photogrammetry turns 2D drone images into 3D models and digital twins, enabling faster, more accurate inspections and asset management. This process replaces time-consuming manual surveys, delivering results 75% faster and identifying 30% more defects. Many users report a return on investment within two months, with cost savings exceeding $100,000.
Key Highlights:
- Data Collection: Use drones equipped with calibrated sensors (cameras, LiDAR, thermal imaging) and plan flight paths with optimal image overlap and Ground Sampling Distance (GSD).
- Processing Software: Tools like RealityCapture, ArcGIS Reality Studio, and OpenDroneMap convert drone data into 3D models, orthomosaics, and point clouds.
- Digital Twin Integration: Platforms like Anvil Labs host, analyze, and enhance these models with AI tools for defect detection, compliance checks, and predictive maintenance.
Benefits:
- Faster inspections and fewer site visits.
- Improved defect detection with AI-powered analysis.
- Simplified collaboration through cloud-based platforms.
This guide walks you through every step - from drone setup to creating actionable digital twins - to streamline operations and reduce costs.
Geospatial Expert Talks: Creating and Capturing 3D Digital Twins: Techniques and Tools
sbb-itb-ac6e058
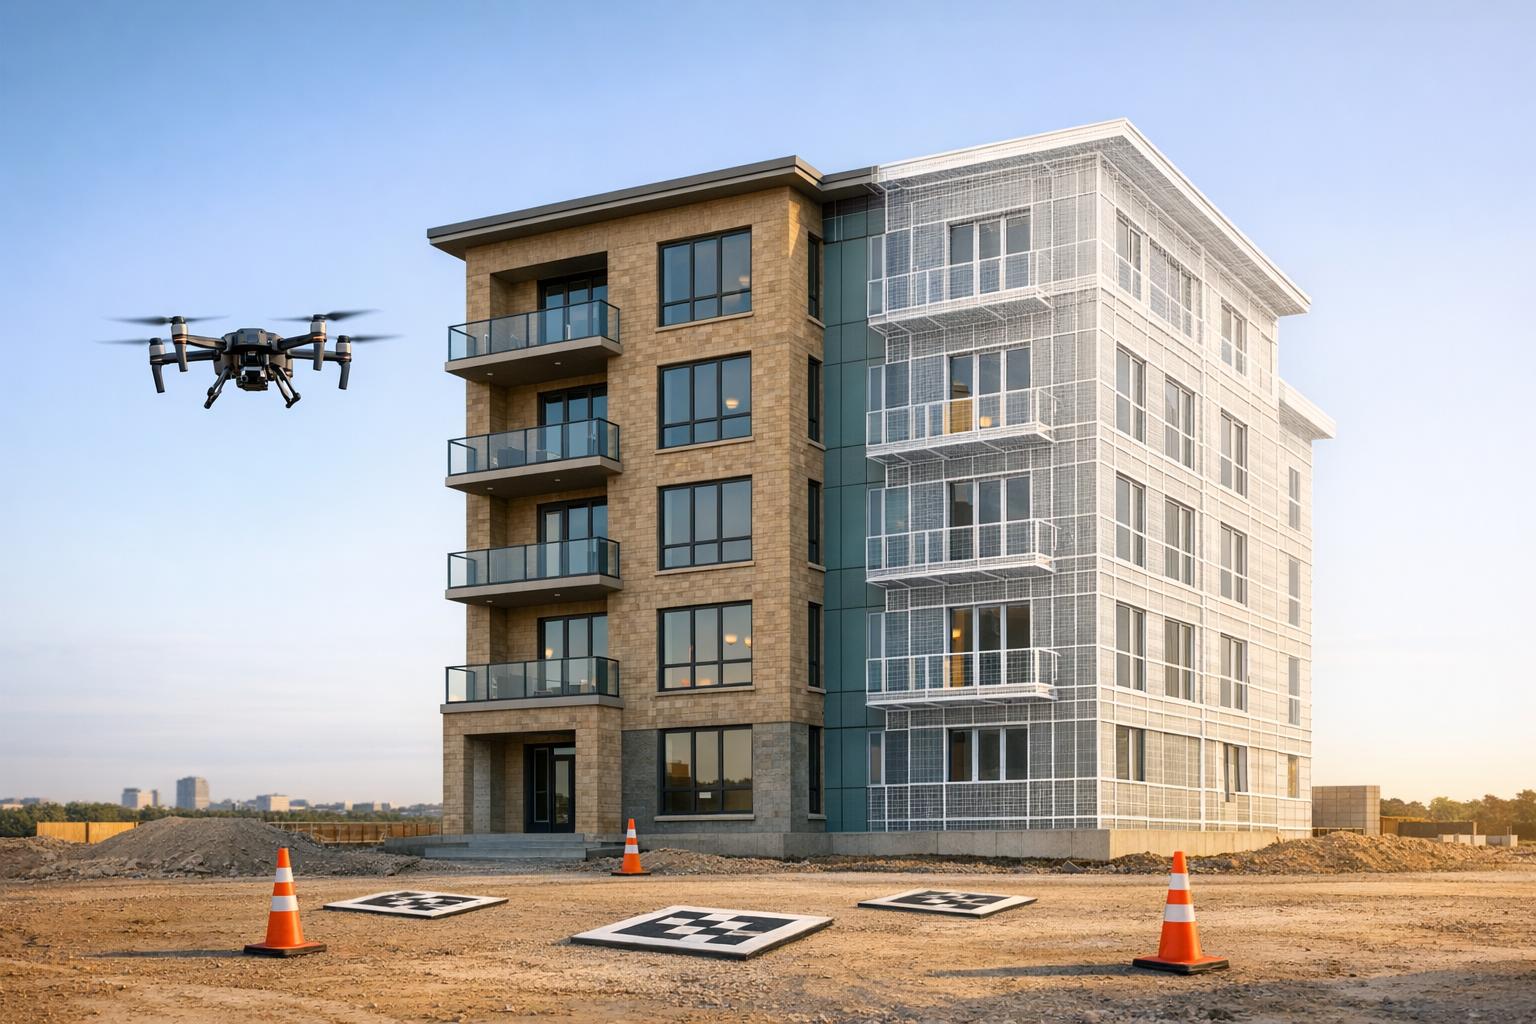
Capturing Data with Drones
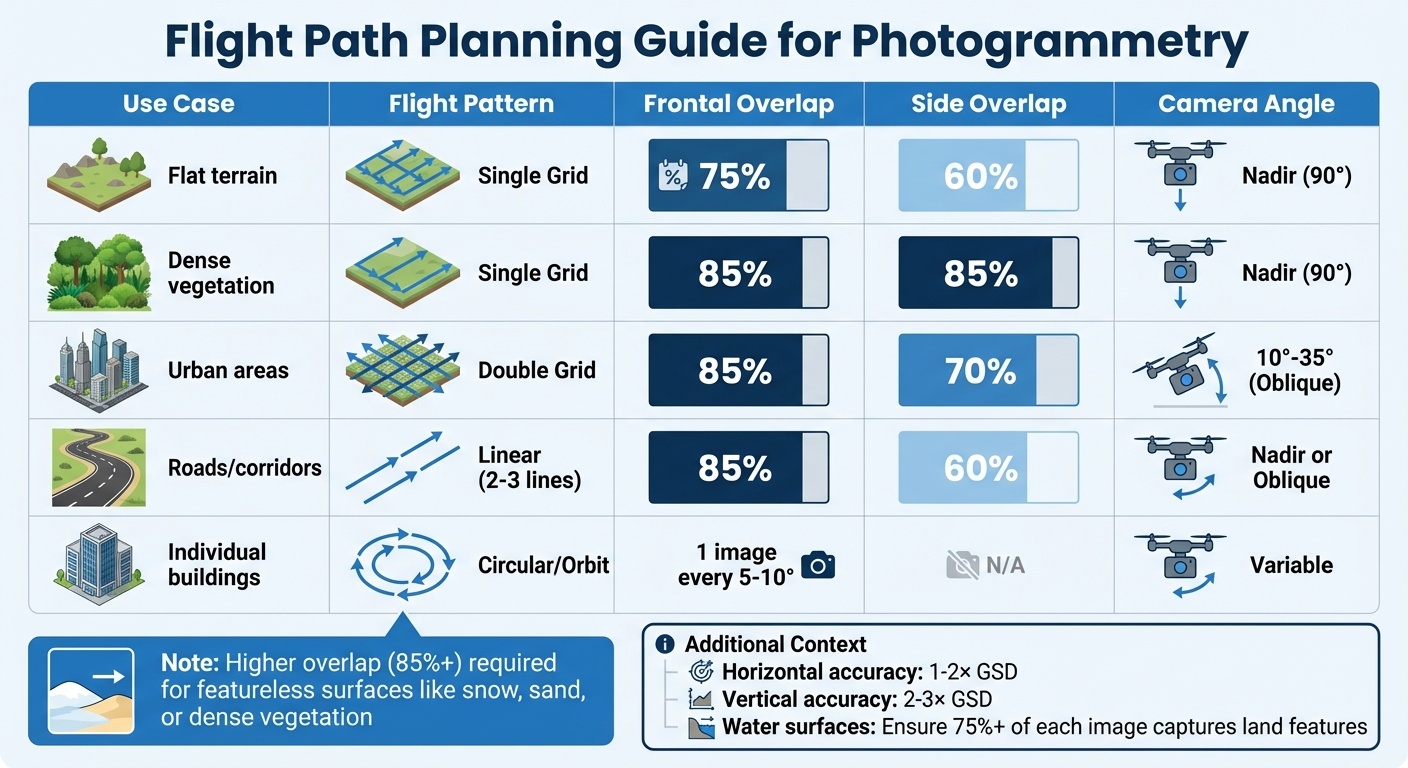
Flight Path Planning Guide for Photogrammetry: Overlap Requirements by Use Case
Creating accurate photogrammetry models starts with collecting high-quality data. The success of your 3D models depends on the drone and sensors you select, how you plan your flight paths, and the steps you take to ensure the data is accurate.
Selecting Drones and Sensors
The right drone is one that balances payload capacity and battery life. Heavier sensors - such as high-resolution cameras, LiDAR units, or thermal imaging equipment - can drain batteries faster, limiting the area you can cover in a single flight. Understanding how a sensor's weight affects flight time will help you plan charging intervals and ensure complete coverage of your target area.
For richer digital models, consider combining different sensors in a single flight. For instance, thermal imaging can detect heat signatures that might indicate equipment issues, while LiDAR provides precise structural measurements, even in poor lighting conditions.
Calibration is a step that often gets overlooked but is crucial for maintaining accuracy. Regularly calibrate your sensors to avoid errors that can snowball during data processing, leading to unreliable measurements and flawed analyses.
When it comes to navigation, choose between LiDAR and Visual SLAM depending on the environment. LiDAR is ideal for GPS-denied areas like tunnels or underground mines, where it maps structures with high precision without relying on visual features. Visual SLAM works best in well-lit outdoor settings but struggles in dark or featureless environments. To stabilize imaging in high-vibration conditions, use industrial-grade gimbals.
Once you've selected and calibrated your equipment, the next step is planning precise flight paths to optimize data quality.
Planning Flight Paths
The way you plan your flight paths has a direct impact on the quality of your photogrammetry results. A key factor here is Ground Sampling Distance (GSD), which measures the distance between pixel centers on the ground. Flying lower results in smaller GSD values (higher detail), but it also reduces the area you can cover. Horizontal accuracy is typically 1 to 2 times the GSD, while vertical accuracy is 2 to 3 times the GSD.
Image overlap is critical for success. For most projects, aim for at least 75% frontal overlap (between consecutive images) and 60% side overlap (between adjacent flight paths). However, certain conditions require higher overlap. For example, dense vegetation, snowy landscapes, or sandy terrains need 85% overlap or more because these surfaces lack clear features for matching. Urban areas with tall buildings benefit from double-grid patterns flown at oblique angles (10° to 35°) to capture facades from multiple perspectives.
| Use Case | Flight Pattern | Frontal Overlap | Side Overlap | Camera Angle |
|---|---|---|---|---|
| Flat terrain | Single Grid | 75% | 60% | Nadir (90°) |
| Dense vegetation | Single Grid | 85% | 85% | Nadir (90°) |
| Urban areas | Double Grid | 85% | 70% | 10°-35° (Oblique) |
| Roads/corridors | Linear (2-3 lines) | 85% | 60% | Nadir or Oblique |
| Individual buildings | Circular/Orbit | 1 image every 5-10° | N/A | Variable |
Maintaining a constant altitude over the terrain ensures uniform GSD across your dataset. For tall structures, fly circular patterns at multiple heights, ensuring 90% overlap between images at the same level and 60% overlap between different levels. When mapping areas with water, make sure at least 75% of each image captures identifiable land features, as water's reflective surface complicates reconstruction.
For the best results, set your camera to manual focus at infinity and turn off internal stabilization and dewarping settings (especially on DJI drones). Overcast skies are ideal for flights, as they minimize harsh shadows and reflections caused by direct sunlight. Also, avoid flying in high winds, which can cause motion blur and reduce image sharpness.
Once your flights are complete, it’s essential to review the data on-site to prevent costly rework.
Checking Data Quality Before Processing
After capturing your data, verify its quality immediately, while still on location. Check image sharpness, confirm that overlap meets the required thresholds, and ensure GPS coordinates are being logged accurately. Catching problems early can save you from having to redo flights later.
Pay close attention to consistent lighting across your images. Sudden changes in brightness can introduce errors during reconstruction. Look for signs of motion blur, especially if you were flying in windy conditions or using slower shutter speeds. Additionally, ensure that Ground Control Points (GCPs) are clearly visible in multiple images. These targets should be 5 to 10 times larger than your GSD to be easily identified during processing. For example, if your GSD is 0.8 inches, GCPs should measure between 4 and 8 inches wide.
When working with LiDAR, adjust the drone's speed to achieve the necessary point cloud density for accurate modeling. Flying too quickly can result in sparse point clouds that miss important details. Also, double-check that all sensor data is synchronized - misaligned timestamps between GPS, IMU, and camera data can lead to georeferencing errors that are difficult to fix later.
Desktop Photogrammetry Software
Once you've gathered high-quality drone data, the next step is processing it into 3D models using desktop photogrammetry software. This process involves four key stages: image matching, feature extraction, triangulation, and dense reconstruction. These steps form the backbone of creating detailed 3D models, with software tailored to meet different project needs.
Your choice of software depends on factors like project size, budget, and technical demands. RealityCapture (renamed RealityScan 2.0 in June 2025) is celebrated for its speed. Its processing time scales linearly with the number of images, making it efficient for various projects. The software is free for students, educators, and businesses earning less than $1 million annually, which makes it an attractive option for smaller teams. For larger-scale mapping, ArcGIS Reality Studio is a go-to choice, offering tools for city-wide and even country-wide mapping with tight GIS integration and survey-grade outputs like true orthophotos and 3D meshes. On the other hand, OpenDroneMap is a no-cost, cross-platform solution that produces high-quality orthophotos, point clouds, and Digital Elevation Models. Its containerized setup ensures smooth operation without licensing fees.
Hardware requirements vary depending on the project. Basic workflows typically need 16–32 GB of RAM, but handling datasets with over 1,000 images may demand 64 GB or more. For GPU acceleration, NVIDIA GeForce RTX cards (3080 or 4000 series) are highly recommended for CUDA-supported software. Storage is equally important - opt for NVMe M.2 SSDs to speed up loading times for your operating system and project files.
"In most cases the maximum project size that can be processed on a machine is limited by the amount of RAM available." - Agisoft Metashape
When executed properly, desktop photogrammetry can achieve 1% to 2% accuracy for stockpile volume measurements, provided the Ground Sample Distance (GSD) is under 1 cm. This precision allows it to serve as a cost-effective alternative to traditional surveying methods, often delivering 60% to 80% savings in various applications.
Processing with RealityCapture
RealityCapture (now RealityScan 2.0) stands out for its speed and flexibility. It supports blending aerial and terrestrial photos with laser scans, making it ideal for projects involving diverse data sources. The software includes AI-assisted masking to remove backgrounds and advanced alignment algorithms for handling surfaces like snow or sand, which typically lack distinct features.
To start, import images with proper EXIF metadata. RealityCapture uses this data to determine initial camera positions. The software then aligns the images, creating a sparse point cloud that outlines the 3D structure of your scene. After alignment, you can review visual heatmaps to spot areas with missing data before generating the final mesh.
For hardware, a minimum of 8 GB RAM and an NVIDIA CUDA 2.0+ GPU with at least 1 GB of memory are required to create textured meshes. Each license supports up to 32 CPU cores and 3 GPUs, with additional licenses needed for higher configurations. The software also integrates aerial LiDAR data, enabling you to combine photogrammetry with precise structural measurements.
Using ArcGIS Reality Studio
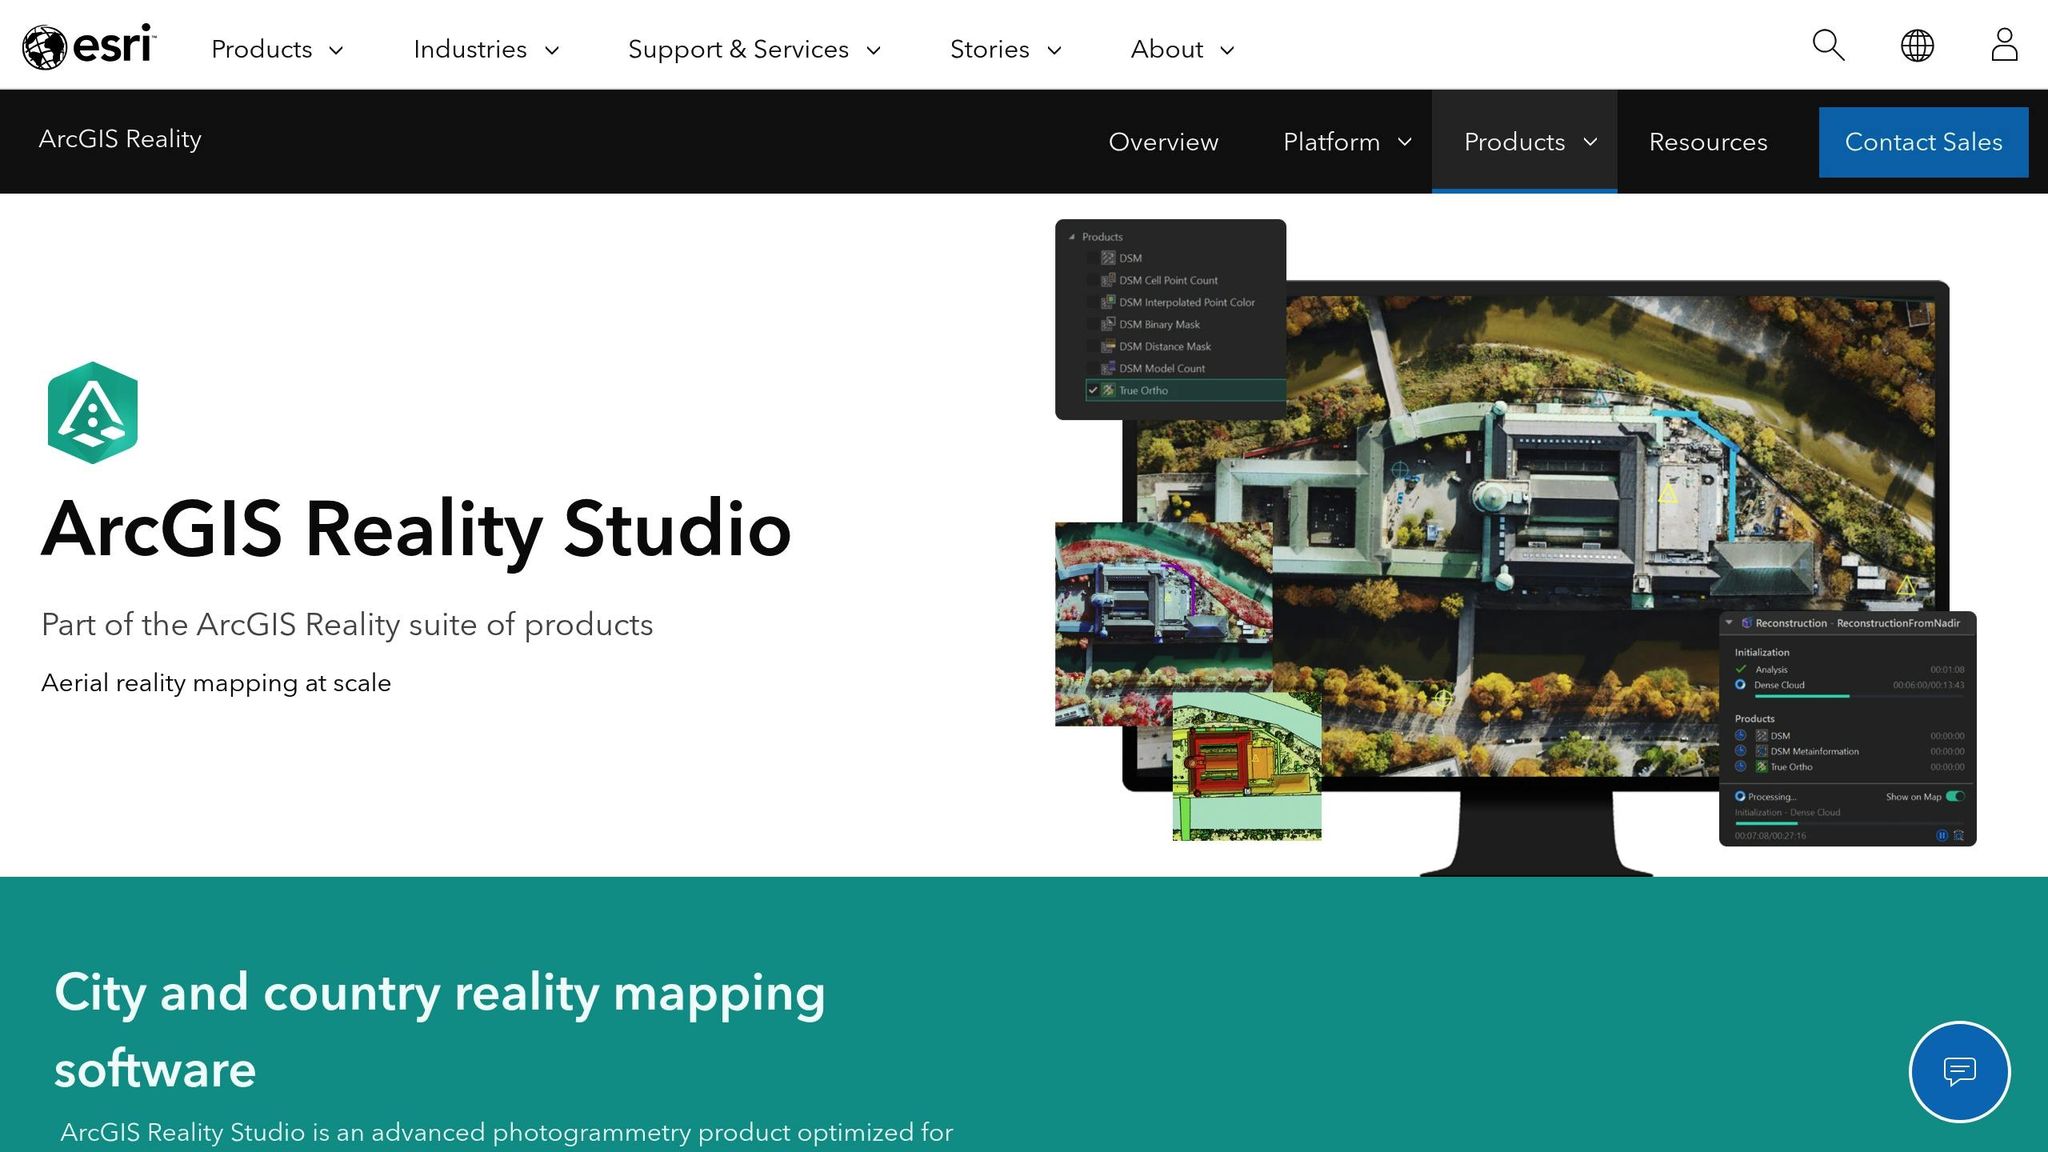
For large-scale mapping, ArcGIS Reality Studio is a powerful option. It was instrumental in creating detailed 3D models of Harvard University and Cambridge, MA, as part of digital twin projects in 2024 and 2025. The process begins by setting up a workspace and performing a block adjustment to calculate image orientations and positions.
When RTK data is unavailable, Ground Control Points can be applied during the block adjustment stage. Ensure your images include metadata and an elevation reference, such as a Digital Elevation Model (DEM) or average elevation, to establish the scene's height. After block adjustment, you can generate 3D meshes, point clouds, or Gaussian splats, which offer more immersive visualizations compared to traditional meshes.
To optimize performance, allocate 90% of CPU cores to reconstruction tasks by adjusting the parallel processing factor. A good rule of thumb is to have 2 GB of RAM per logical processor - for instance, a 16-core system would need at least 32 GB of RAM. Ensure your storage setup can handle large datasets, with at least 10 times the total size of the images being processed. For a typical aerial dataset, this means 50 GB or more.
Setting Up OpenDroneMap

OpenDroneMap (ODM) is a free, containerized software that works across platforms. Its containerized design ensures compatibility regardless of your local system setup. WebODM, a user-friendly interface for ODM, includes the Potree 3D viewer for analyzing measurements like volume, area, slope, and height.
For high-quality results, set feature and point cloud quality to high. If you're working on terrain-only models, use the --dtm true setting. For models that include buildings and vegetation, switch to --dsm true. When handling urban areas, increase --mesh-size to 300,000–600,000 and set --mesh-octree-depth to 10–11 for better reconstruction of building details.
ODM uses a Simple Morphological Filter (SMRF) to distinguish ground points from non-ground points during terrain modeling. For stockpile volume measurements, fly at heights three to four times the tallest stockpile, maintaining an overlap of 75% to 80%. A point budget of 1 to 2 million works for mid-range machines, while 5 to 7 million points provide smoother models but demand more resources for tasks like digital twin integration.
Connecting Photogrammetry to Digital Twin Platforms
Once drone imagery has been processed into 3D models, orthomosaics, and point clouds, the next logical step is to transfer this data into a digital twin platform. This process transforms static photogrammetry outputs into dynamic, interactive digital twins that teams can use for inspections, measurements, and deeper analysis. The workflow typically involves uploading the processed data, utilizing built-in annotation and measurement tools, and integrating various data types to create a detailed digital representation of physical sites. This connection bridges the gap between photogrammetry outputs and the interactive capabilities of digital twin platforms.
Uploading 3D Models to Anvil Labs
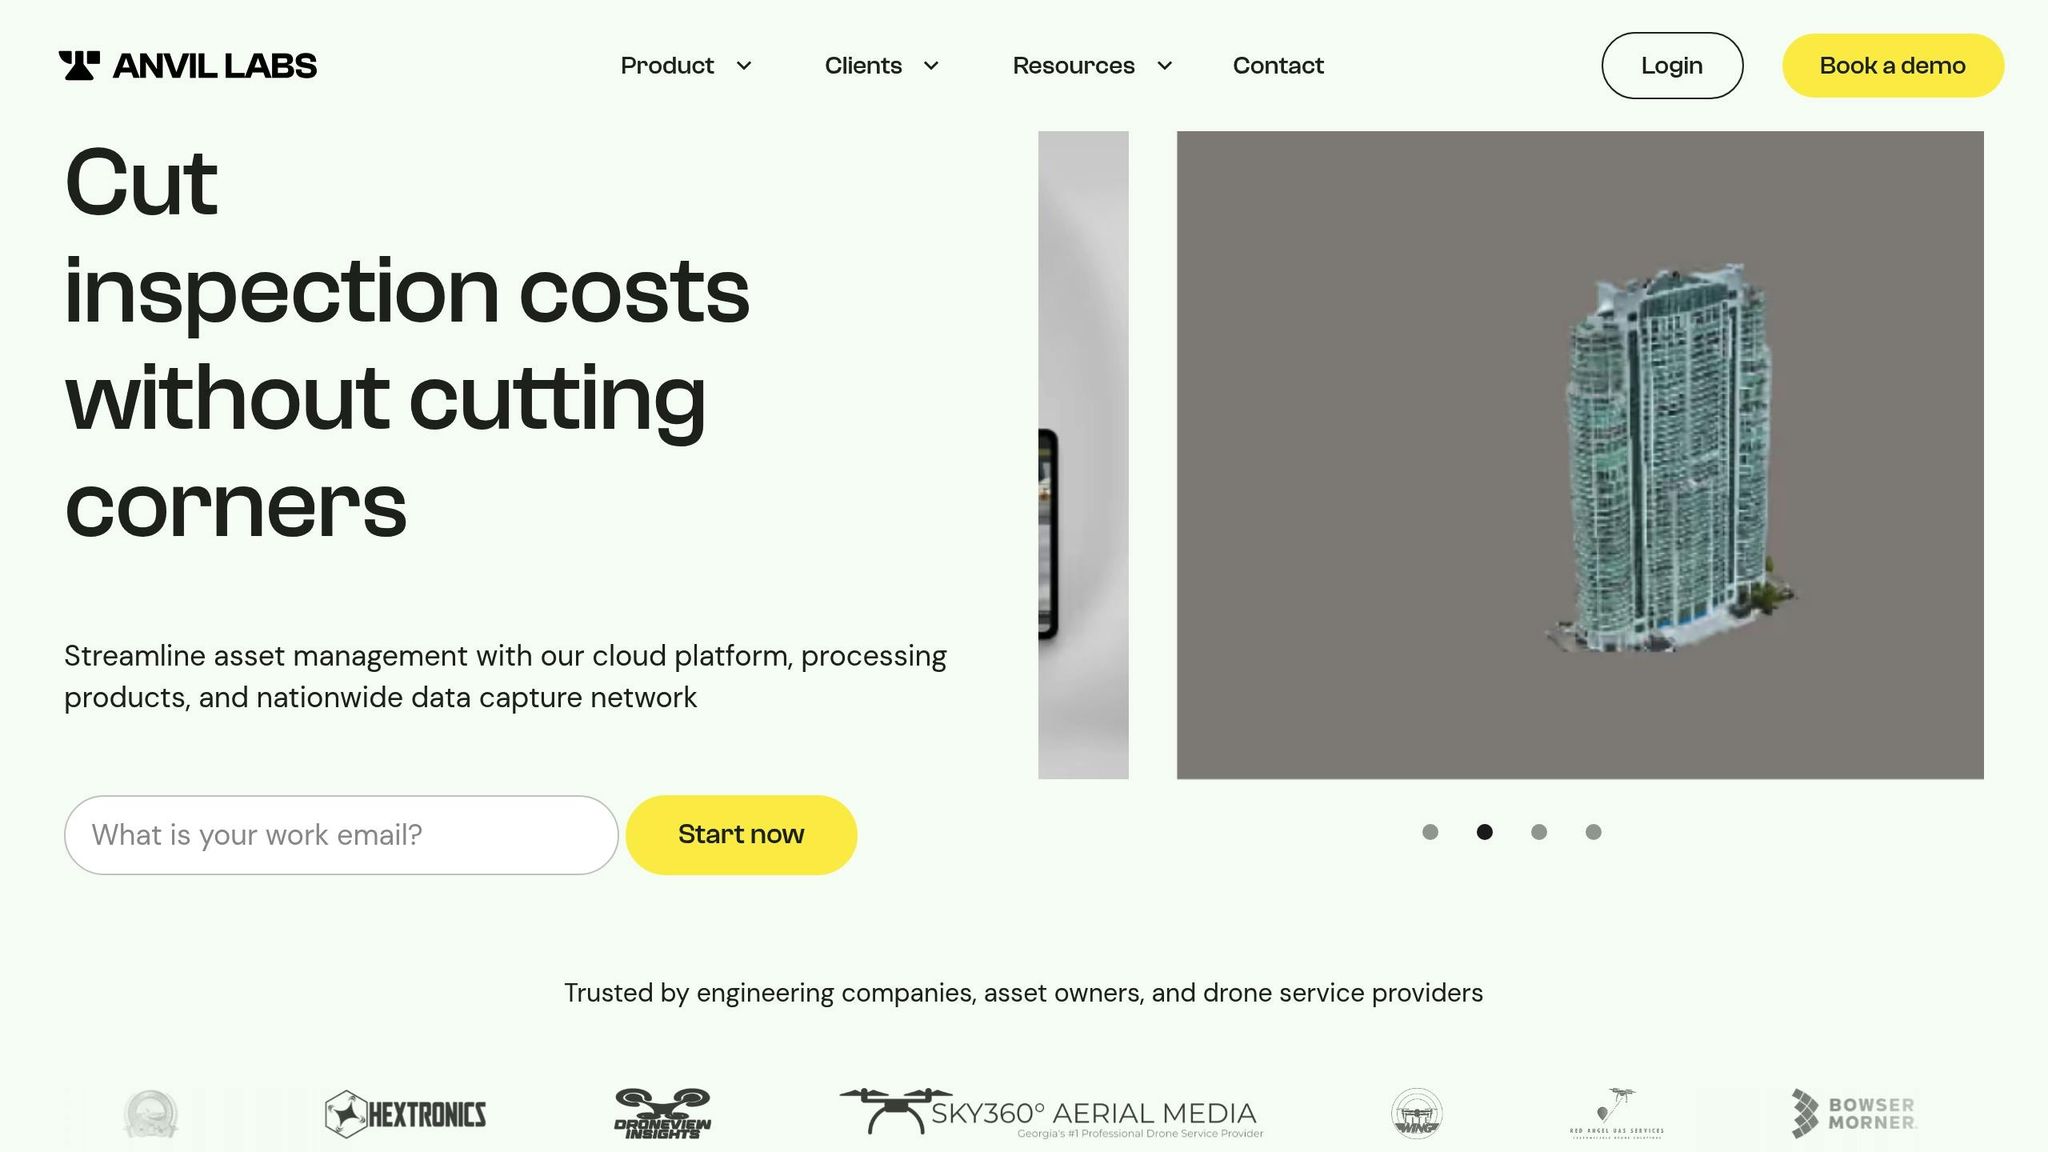
Anvil Labs offers a cloud-based Asset Viewer designed to centralize photogrammetry outputs, making them accessible for secure storage and team collaboration. The workflow includes data capture, upload, inspection, and secure sharing. For teams without local processing capabilities, Anvil Labs provides a service to convert raw images into high-resolution 3D models and orthomosaics for US $3 per gigapixel. The Asset Viewer subscription costs US $99 per month, with an additional US $49 per-project hosting fee. To ensure data security, the platform employs encryption, password-protected links, and role-based access controls. If a subscription expires, project data is retained but disabled for access.
"I had a meeting yesterday with my clients and they really liked the panoramas. I appreciate all the cool tech you've got here. This saves me from DroneDeploy! The per project pricing makes it easy for me to bill customers." – Connor Barnes, Leading Edge Environmental and Emergency Services
Once your 3D models are securely hosted, the next step is to enhance them with actionable insights.
Using Annotation and Measurement Tools in Anvil Labs
After uploading, Anvil Labs provides tools for annotation and measurement, enabling users to conduct spatial analysis, add assets, and perform inspections directly within the 3D environment. These features are designed to turn static models into actionable digital twins. AI-powered analysis further streamlines defect detection and speeds up inspection workflows. With its efficient setup, combined with per-project pricing and strong role-based access controls, many users report seeing a return on investment in as little as two months. Some have even noted savings exceeding US $100,000.
"My overall experience with the software has been satisfying because of the efficient workflow. I would highly recommend other organizations to use your software simply because of how much value you get for what you pay for... The ROI is clearly marked within the first few uses." – Angel Rojas, Red Angel Drones
Working with Orthomosaics, LiDAR, and Thermal Data in Anvil Labs
Anvil Labs goes beyond standard 3D models by supporting a variety of data types, including orthomosaics, LiDAR point clouds, thermal imagery, and 360° panoramas. This multi-sensor approach enhances the analytical capabilities of digital twins by combining visual, thermal, and structural data into one platform. To ensure accuracy, users should calibrate sensors and validate outputs, and when working with LiDAR data, convert LAZ files to LAS format if necessary. By integrating these diverse data types, Anvil Labs creates unified digital twins that can be used to manage infrastructure like bridges, highways, buildings, utilities, and mining sites. The platform’s cross-device accessibility - available on desktops, tablets, and mobile devices - provides a competitive edge for professionals who need more than just raw footage.
"This is a differentiator. Those that aren't able to provide visualization but are just doing raw footage - this gives you, in my opinion, that competitive edge." – Adrian, Drone Service Provider
Through these integration steps, processed photogrammetry data evolves into a dynamic, multi-sensor digital twin ready for comprehensive analysis and informed decision-making.
Analysis and Workflow Improvements
Once integration is complete, teams shift their attention to turning data into actionable insights and coordinating operations remotely. This stage is crucial for determining how efficiently teams can identify problems, make decisions, and collaborate across different devices and locations. What sets modern digital twin workflows apart from traditional inspection methods is their reliance on AI-powered analysis and cross-device collaboration. Anvil Labs takes these capabilities a step further, enabling teams to work seamlessly across devices while leveraging advanced analytics.
Using AI Tools with Anvil Labs
Anvil Labs integrates with AI tools to automate spatial analysis, transforming raw photogrammetry data into meaningful insights. A key focus of this AI integration is defect detection, including identifying corrosion and structural issues, which helps reduce the risk of human oversight. The results are impressive: AI-powered inspections are completed 75% faster and detect 30% more defects compared to traditional methods. By combining historical and real-time data, the platform’s machine learning models create predictive insights, allowing teams to anticipate asset stress points and shift toward proactive maintenance.
Instead of waiting for failures to occur, teams can now forecast potential issues and optimize maintenance schedules in advance. The platform also includes specialized AI modules for tasks like thermal image analysis and hyperspectral imaging, which can detect risks such as asset failures or even plant diseases - problems that are often invisible to the naked eye.
Additionally, automated compliance checks ensure that regulatory standards are met quickly and efficiently. This not only reduces reporting time but also minimizes the risk of penalties. Many users report seeing a return on investment within just two months of adopting these automated workflows, with some achieving savings of over $100,000.
Collaborating Across Devices
Anvil Labs’ cloud-based platform centralizes photogrammetry data, making it accessible on desktops, tablets, and mobile devices. This cross-platform functionality removes data silos, ensuring that team members can work from any device without needing to be in the same location. Role-based access controls safeguard sensitive information by limiting access to authorized users only.
The platform’s consistent billing structure and cross-device accessibility simplify both collaboration and cost management. Automated reporting tools further enhance teamwork by instantly generating and sharing inspection results and spatial analysis reports. This eliminates the need for time-consuming manual compilation and distribution, saving teams valuable time and effort.
| Workflow Aspect | Traditional Manual Inspection | AI-Enhanced Anvil Labs Workflow |
|---|---|---|
| Inspection Speed | Slow and labor-intensive | 75% faster inspections |
| Defect Detection | Higher risk of human error | 30% more defects identified via AI |
| Compliance Tracking | Manual audits and documentation | Automated compliance checks |
| Site Visits | Multiple trips for verification | Reduced visits via remote analysis |
| Cost | High labor and travel expenses | Lower costs through automation |
Building Scalable Photogrammetry Workflows
Scaling photogrammetry workflows to handle growing data volumes requires shifting from traditional methods to standardized cloud-based systems. The starting point? Consistent data capture across all locations. By deploying a nationwide network of drone operators equipped with calibrated sensors, you can ensure uniform data quality. This eliminates the inconsistencies often seen with manual inspections and provides a reliable foundation for analysis. Standardization like this is key to maintaining consistent quality as operations expand to new sites.
Once data is integrated into digital twin platforms, scalability becomes all about efficiency. Cloud-based processing is a game-changer here - it eliminates infrastructure bottlenecks, enabling faster processing of 3D models and orthomosaics. Centralizing data management also speeds up analysis by avoiding issues like file fragmentation or delays in rendering.
Cost control is another major piece of the puzzle. Traditional cloud processing often comes with unpredictable pricing, making budgeting and billing a headache. Many in the industry advocate for transparent, per-project pricing models, which simplify financial planning and make scaling operations much easier.
Automation is another critical element. Tools powered by AI can take over tasks like defect detection and compliance tracking, reducing human error and cutting down on the need for repeat site visits. This automation not only streamlines documentation but also delivers substantial savings. Experts report that automated workflows can generate ROI in as little as two months, with cost savings surpassing $100,000.
Scalable workflows also create a competitive edge by turning raw data into actionable insights. Combining standardized data capture, cloud-based processing, predictable pricing, and automated analysis allows teams to grow their operations without sacrificing accuracy or efficiency. These workflows form the backbone of digital twin systems that evolve alongside the demands of the industry.
Conclusion
Photogrammetry workflows today seamlessly integrate data collection and digital twins, turning raw imagery into actionable 3D models that help teams make smarter decisions on industrial sites. By combining drone-based data gathering with desktop processing tools and cloud platforms like Anvil Labs, these workflows are delivering tangible results.
Recent success stories highlight some impressive outcomes: 75% faster inspections, 30% more defects identified, and cost savings of over $100,000 compared to traditional manual methods. Even more compelling, most users see a return on investment within just two months.
"The ROI is clearly marked within the first few uses." – Angel Rojas, Red Angel Drones
The benefits don’t stop there. Simplified pricing structures make client billing easier, and offering 3D visualizations instead of just raw footage sets businesses apart in a competitive market.
"This is a differentiator. Those that aren't able to provide visualization but are just doing raw footage - this gives you, in my opinion, that competitive edge." – Adrian, Drone Service Provider
The move from manual to automated, AI-powered workflows has also brought significant advantages. These systems reduce human error, enable real-time collaboration across devices, and streamline compliance tracking. By automating repetitive tasks, teams avoid costly rework and project delays.
The results clearly show the value of adopting an integrated, automated approach. Scalable photogrammetry workflows depend on standardized data collection, cloud-based processing, transparent pricing, and automation. Platforms like Anvil Labs bring these elements together, enabling teams to expand their operations while maintaining precision and efficiency - turning spatial data into a powerful strategic tool.
FAQs
How does photogrammetry help detect defects during inspections?
Photogrammetry enhances defect detection by generating detailed 3D models that highlight issues such as cracks, misalignments, or deformations with impressive precision. These models give inspectors a clear, real-time perspective of assets, making it easier to catch problems early in the process.
With the integration of advanced tools, including AI, photogrammetry can detect up to 85% of potential errors. This capability helps teams cut down on expensive rework, improve safety measures, and meet regulatory standards. By streamlining inspections, this technology provides a quicker and more accurate way to oversee and maintain critical assets.
What should I consider when planning drone flight paths for photogrammetry and digital twin data collection?
When planning drone flight paths for photogrammetry or creating digital twins, prioritizing accuracy, efficiency, and safety is key. Start by using flight patterns like grid or lawnmower paths. These ensure consistent coverage and maintain proper image overlap - aim for 75% front overlap and 60% side overlap. This approach helps generate precise 3D models and reduces the risk of stitching errors.
Environmental conditions play a big role in data quality. Opt for clear weather with minimal wind and soft lighting. This helps avoid shadows and motion blur, both of which can compromise the final results. Before launching, take time to review the site for any obstacles or tall structures that could interfere with the drone's flight or leave gaps in the captured data.
For improved georeferencing accuracy, especially in large or uneven areas, use Ground Control Points (GCPs). To take it a step further, drones equipped with RTK (Real-Time Kinematic) positioning can provide even greater precision. Thoughtful planning is the foundation for collecting high-quality data for your digital twin projects.
How do digital twin platforms like Anvil Labs improve photogrammetry workflows?
Digital twin platforms, such as Anvil Labs, simplify photogrammetry workflows by bringing together data integration, visualization, and management in one place. These platforms make it possible to securely store and process massive datasets like 3D models, LiDAR scans, and thermal imagery - all within a single, user-friendly system.
Equipped with features like real-time collaboration, detailed annotation tools, and accurate measurement capabilities, they help professionals make better decisions and work more efficiently on tasks like asset monitoring and site management. Plus, their compatibility with multiple devices and integration with advanced tools ensures a smooth workflow tailored to the needs of modern professionals.
