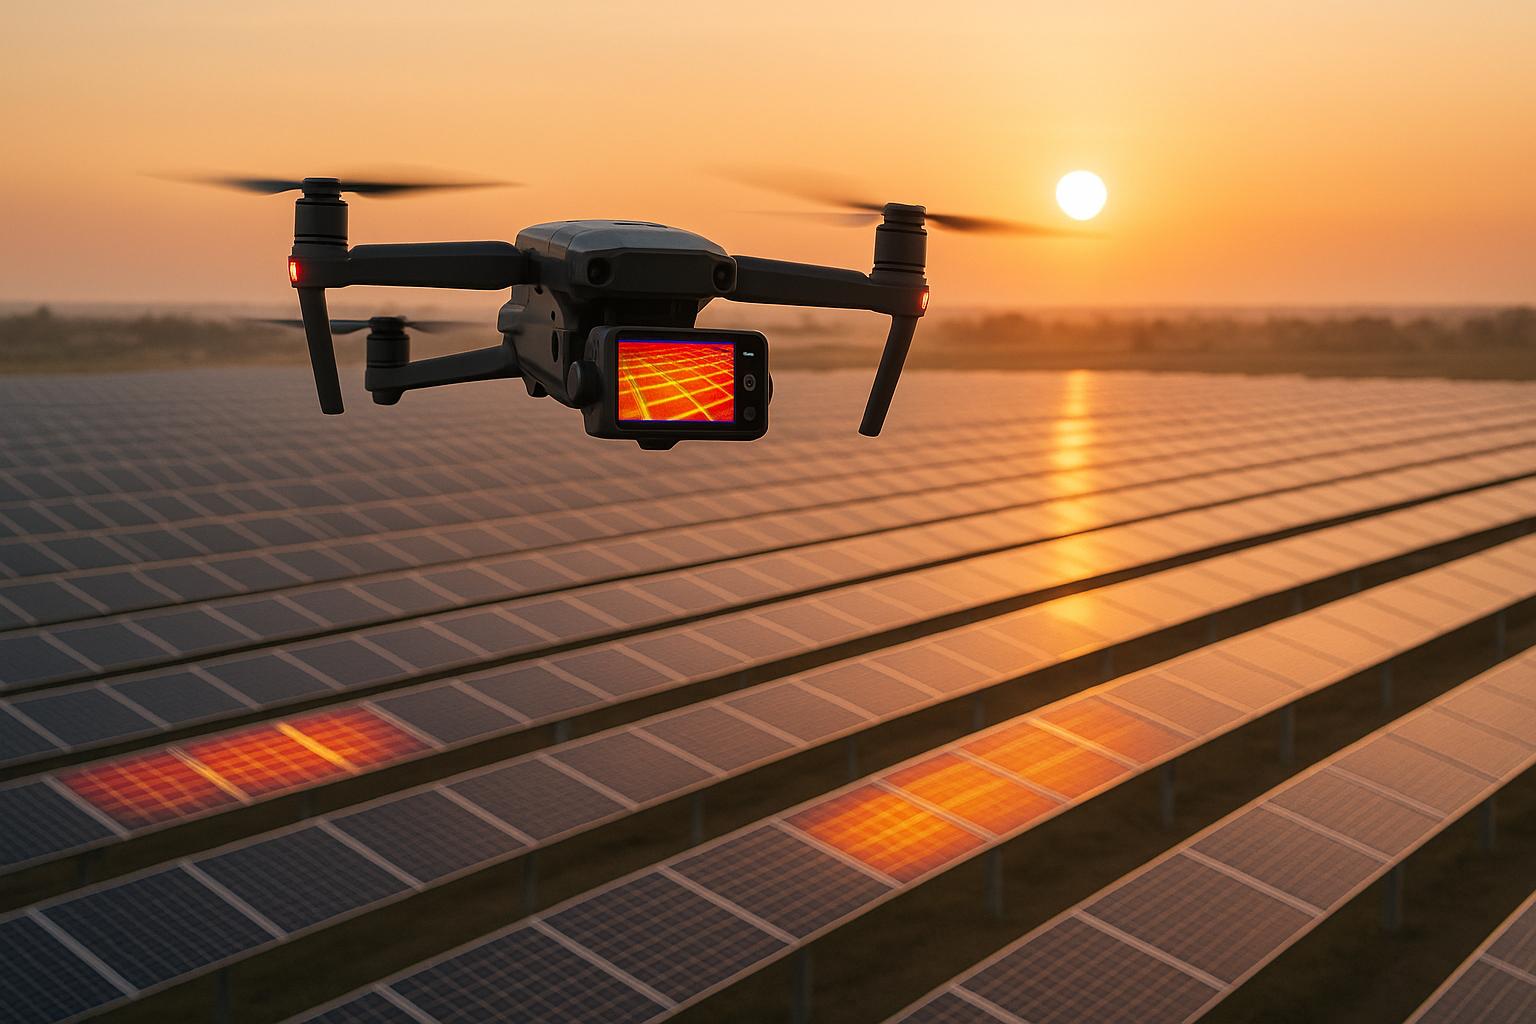
Thermal drones, equipped with infrared cameras, help identify problems in industrial systems by spotting temperature anomalies like hotspots, cold spots, or gradients. These drones are widely used in industries such as power, manufacturing, construction, and renewable energy to detect electrical faults, mechanical wear, insulation damage, and leaks. By providing detailed thermal data, they allow maintenance teams to act quickly, improving safety and reducing costs.
Key takeaways:
- Applications: Inspect power systems, pipelines, solar panels, and more.
- Common issues detected: Overheating components, failing bearings, insulation gaps, and leaks.
- Advantages: Faster inspections (up to 75% time saved), 30% higher defect detection, and reduced downtime.
- Tools: Radiometric thermal sensors and platforms like Anvil Labs help visualize and manage data effectively.
Thermal drones streamline asset inspections, making maintenance smarter and more efficient.
Thermal Drone Inspections for Industrial Plants | LEGO Heat Detection Story

Failure Modes Detectable by Thermal Drones
Thermal drones are invaluable for spotting asset failures like electrical faults, mechanical wear, insulation breakdowns, leaks, and process disruptions. They do this by identifying unusual heat patterns - hotspots, cold spots, or unexpected temperature gradients - caused by changes in resistance, friction, or fluid flow. These anomalies stand out clearly when compared to normal operating conditions.
Common Asset Failures and Their Thermal Signatures
Electrical failures are one of the most frequently identified issues. Problems like overloaded circuits, loose connections, or failing breakers appear as distinct hotspots with temperatures significantly higher than surrounding components. For instance, a loose connection on a bus bar might register 210–230 °F, while neighboring connections operate within a cooler 140–160 °F range. Radiometric thermal cameras, capable of measuring precise temperatures for each pixel, make it easy to pinpoint overheating components in complex systems.
Mechanical problems in rotating equipment produce a different thermal signature. Issues like failing bearings, misaligned drives, or lubrication problems generate friction, leading to elongated hotspots along bearings, couplings, or motor housings. For example, a pump bearing might heat up from the usual 140–160 °F range to 190–220 °F, signaling the need for maintenance to avoid a larger failure.
Insulation damage on equipment like boilers, furnaces, or process vessels shows up as irregular hotspots or bands of elevated temperature on surfaces that should otherwise be uniform. Damaged insulation allows heat to escape, creating sharp temperature contrasts. Inspectors look for streaks or expanding warm areas several degrees higher than their surroundings, which could indicate compromised insulation and potential safety risks.
Leaks in pipelines or process lines also create unique thermal patterns. The appearance of these patterns depends on the type of fluid and environmental conditions, such as wind or sunlight. Inspectors compare suspected anomalies to nearby reference areas, ensuring that natural temperature variations aren’t mistaken for actual leaks.
Industry standards often recommend classifying anomalies by the temperature difference compared to similar components. Minor issues might show a rise of 18–36 °F, while larger deviations demand immediate or planned corrective actions.
Here’s a quick summary of common failures, their thermal signs, and typical maintenance actions:
| Failure Mode | Thermal Signature | Temperature Pattern | Maintenance Trigger |
|---|---|---|---|
| Loose electrical connection | Sharp hotspot at junction | 210–230 °F vs. 140–160 °F | Immediate inspection and tightening |
| Failing bearing | Elongated heat along housing | 190–220 °F vs. 140–160 °F | Scheduled bearing replacement |
| Insulation breakdown | Irregular surface hotspots | Hotspots several degrees above surroundings | Repair or replace insulation |
| Steam leak | Linear hotspot along pipe | Distinct anomaly relative to baseline | Inspection and leak repair |
| Solar module defect | Individual panel hotspot | Noticeable difference from adjacent panels | Inspect and repair module or connectors |
Industrial Assets Suitable for Thermal Inspections
Electrical substations and power distribution systems are prime candidates for thermal inspections. Drones can quickly assess transformers, bushings, insulators, disconnect switches, bus bars, and terminations, where heat from loose connections, corrosion, or internal faults may signal trouble.
Pipelines, steam lines, and tank farms also benefit from thermal drone surveys. These drones can scan long stretches of pipe, elevated racks, and even buried lines, identifying leaks or insulation problems early. Catching these issues promptly helps prevent energy loss, environmental damage, and pressure-related failures.
Solar arrays are another area where thermal drones shine. Defective modules or cell groups often show up as isolated hotspots compared to surrounding panels. Identifying these problems allows maintenance teams to act quickly, ensuring the system operates at peak efficiency.
Manufacturing plants and process facilities use thermal drones to monitor critical equipment like motors, pumps, compressors, and heat exchangers. By detecting excessive heat, regular inspections support predictive maintenance programs, reducing the risk of costly breakdowns.
Flare stacks, pressure vessels, and district heating networks also benefit from routine thermal surveys. For example, abnormal heat patterns on flare stacks may point to refractory lining issues, while underground leaks in district heating systems can be identified through subtle surface temperature changes.
Thermal drone surveys are particularly effective for high-value or hard-to-access assets, such as electrical substations, transmission lines, tank farms, flare stacks, solar fields, and large industrial plants. U.S. operators have reported numerous advantages, including reduced unplanned downtime, safer inspections, faster survey times, and cost savings from addressing issues early.
Drones make inspections faster and more efficient, often cutting survey times from days to hours. They eliminate the need for scaffolding or full shutdowns, enabling non-contact assessments. Advanced platforms like Anvil Labs enhance these inspections by integrating thermal imagery with 3D models, orthomosaics, and other data types. This allows teams to visualize anomalies in context, track temperature trends, and seamlessly create work orders. By feeding these insights into digital workflows, teams can act quickly to resolve issues and maintain asset reliability. Thermal drones are proving to be a game-changer in keeping industrial systems running smoothly.
Choosing the Right Drone and Thermal Sensors
When it comes to inspecting assets through thermal imaging, picking the right combination of drones and sensors is essential. The wrong setup could miss critical issues, while over-investing in unnecessary features might waste your budget. The goal is to align the drone and sensor capabilities with your specific needs - whether that’s the type of assets you’re inspecting, the environment you’re working in, or the outcomes you’re aiming for. Below, we’ll break down the key sensor features and drone capabilities that ensure reliable and efficient inspections.
Key Sensor Specifications to Consider
Thermal resolution is a top priority when choosing a sensor. It determines how much detail you’ll see, especially for small components at typical inspection distances of 100–400 feet. For example, a 640×512 sensor delivers much sharper images than a 320×256 model, which is crucial when spotting small hotspots. Higher resolution reduces the need for risky close-up flights or time-consuming rechecks.
For routine industrial inspections, a 320×256 radiometric camera might be sufficient. But if you’re inspecting high-voltage lines, complex substation equipment, or dense piping, upgrading to 640×512 or higher resolution is often worth it. The added detail helps pinpoint issues like an overheating fuse or a hot connection inside a substation - problems that used to require handheld inspections up close.
Thermal sensitivity, measured as NETD (Noise Equivalent Temperature Difference), is another critical factor. A sensor with a NETD of 50 mK or lower (ideally 40 mK or better) can detect subtle temperature differences. This level of sensitivity is essential for catching early signs of trouble, like slightly overloaded conductors or minor insulation failures. Without good sensitivity, small temperature changes - like a 10–15 °F rise - could go unnoticed, potentially leading to bigger problems down the line.
Field of view (FOV) is about finding the right balance between speed and detail. Wide-angle lenses are great for covering large areas quickly, while narrower lenses or zoom options are better for tall or distant structures. Some operators prefer dual-lens systems or interchangeable payloads to handle different inspection scenarios without needing multiple drones.
Radiometric capability is a must-have for industrial inspections. Radiometric cameras provide precise temperature data for every pixel, making it easier to measure temperatures, set thresholds, and monitor trends over time. Non-radiometric cameras can highlight hot spots but won’t tell you the exact temperature - critical when deciding between urgent repairs and scheduled maintenance. Radiometric data also supports detailed reports for insurance claims, compliance, and maintenance documentation.
Temperature range and calibration options ensure your camera can handle both ambient conditions and the high heat typical of industrial equipment. For example, while low-voltage panels might operate at 100–140 °F, process lines or flare stacks can reach several hundred degrees. Adjustable temperature scales and color palettes help highlight small deviations, while emissivity controls improve accuracy when measuring different materials like metal or insulation.
Recommended Drone Features for Industrial Sites
While sensors are vital, your drone’s features can make or break the effectiveness of your inspections.
Dual RGB/thermal payloads combine visual and thermal data, helping you pinpoint and document faults more effectively. For example, synchronized visual and infrared views make it easier to identify specific components, like a cracked module or a leaking valve, even in complex setups. The RGB camera adds necessary visual context, ensuring maintenance teams know exactly what’s wrong and where to find it.
Flight stability and control are critical for safety and data quality. Enterprise-grade drones with stable hover, precise positioning, and redundant systems are better suited for industrial sites. Features like obstacle sensing, terrain-following, and waypoint navigation help maintain consistent distances and angles during inspections. Stabilized gimbals reduce motion blur, ensuring clear thermal images even in windy conditions.
Environmental resilience is key for drones operating in challenging conditions. Industrial sites often experience extreme temperatures, high winds, and exposure to dust or moisture. Your drone should be able to handle local weather extremes, whether it’s freezing winters in the Midwest or scorching summers in the Southwest. Look for ingress protection ratings to guard against dust and moisture, ensuring long-term reliability.
Flight endurance directly impacts efficiency. Long-lasting batteries or hot-swappable power systems reduce downtime during inspections, allowing for fewer takeoffs and landings. Most industrial drones offer 30–40 minutes of flight time, though payload weight and wind conditions can affect this. Faster inspections mean less disruption to active operations and safer workflows in restricted areas.
Payload flexibility adds value to your investment. Modular systems let you use one drone for multiple tasks, such as thermal inspections, LiDAR mapping, or high-resolution visual surveys. Multi-sensor payloads are especially useful for industries like oil and gas, where a single flight can detect temperature anomalies, structural issues, and gas leaks, all while improving safety and efficiency.
Navigation and safety features are essential for compliance and reliability. Features like GPS/GNSS positioning, geofencing, and return-to-home functions ensure safe operation near critical infrastructure. In areas with high electromagnetic interference, such as near power lines or communication towers, drones with interference-resistant navigation systems are less likely to lose control or drift off course.
Data integration capabilities can streamline your workflow. Drones that support automated flight routes and seamless data export make it easier to integrate inspection results into maintenance systems. For instance, platforms like Anvil Labs allow you to combine thermal maps, 3D models, and other data into a unified view. This makes it simple to review anomalies, annotate issues, and share findings with teams or contractors, turning raw data into actionable insights.
When selecting equipment, consider the importance of the assets you’re inspecting. High-value equipment may justify investing in advanced radiometric sensors, while mid-range systems might suffice for less critical assets. Matching the right tools to your needs ensures efficient and reliable inspections without overspending.
Planning and Executing Thermal Drone Inspections
Good planning is the backbone of any successful thermal drone inspection. It ensures every flight achieves its goals, avoids surprises, and gathers the data needed for actionable insights.
Mission Planning for Effective Data Collection
Start with clear objectives. Are you scanning transformers for overheating, inspecting steam lines for leaks, or assessing rooftop HVAC systems? Each goal requires specific settings like altitude, overlap, and temperature accuracy to detect issues effectively.
Understand the site and its challenges. Take a walkthrough - whether in person or virtually - to identify obstacles like overhead wires, active cranes, or restricted areas. Look for no-fly zones, GPS interference risks, or temporary construction. This groundwork helps you plan safe takeoff and landing spots while avoiding mid-flight surprises.
Determine the frequency of inspections. If this is part of a recurring maintenance program, standardize routes, altitudes, and camera angles to make thermal data comparable over time. Save these configurations as waypoint missions to ensure consistency.
Follow airspace rules and site regulations. Make sure you’re compliant with FAA Part 107 guidelines, secure any necessary airspace authorizations, and coordinate with facility safety teams to align with on-site restrictions.
Plan for flight time and battery needs. Larger industrial sites often require multiple flights. Estimate how long each battery will last, factoring in altitude, wind conditions, and payload weight. Running out of battery mid-flight can create data gaps, so plan accordingly.
Prepare a risk assessment. Identify potential hazards like electromagnetic interference, high winds, or restricted zones. Outline strategies to mitigate these risks, such as geofences, emergency landing zones, or assigning roles to the team, including remote pilots and visual observers.
Account for weather and timing. Avoid flying in rain, fog, or strong winds, as these conditions can destabilize the drone or distort thermal readings. Early morning or late evening often provides better thermal contrast, especially in hot climates where retained heat highlights defects against cooler surroundings.
Leverage digital tools for mission planning. Platforms that integrate 3D models, thermal imagery, and geospatial data simplify flight path design and data sharing. For instance, tools like Anvil Labs let teams overlay thermal layers on 3D facility models, making it easier to annotate findings, share results, and refine inspection templates. Centralized data storage ensures everyone - from operations to maintenance - can access and act on the findings.
Once the plan is in place, the focus shifts to capturing the best possible thermal data.
Best Practices for Capturing Thermal Data
A well-thought-out plan sets the stage for precise and reliable data collection during the flight.
Find the right altitude. Most industrial inspections are conducted between 100 and 400 feet above the asset. Higher altitudes cover more area but sacrifice detail, while lower altitudes capture finer features but increase the risk of collisions. Match your altitude to the resolution of your sensor and the size of the components being inspected.
Maintain slow and steady flight speeds. Flying at a consistent, slower pace helps avoid motion blur and ensures sensors capture accurate temperature readings. Keep the gimbal angle steady throughout the mission to make comparisons across flights easier.
Set high overlap for better mapping. Aim for 70–80% overlap between images to improve accuracy and make it easier to identify anomalies on complex surfaces. While this increases flight time and the amount of data collected, the result is a seamless thermal map that maintenance teams can trust.
Conduct thorough preflight checks. Before launching, verify the drone and battery health, calibrate sensors, check GPS lock, and test obstacle avoidance systems. A brief hover test can confirm everything is functioning as expected. Document these steps with a checklist to support safety audits and compliance.
Review sample images on-site. After each flight, inspect a few thermal images or video clips on a tablet or laptop. Check for proper focus, good contrast, accurate temperature scales, and minimal blur. If issues arise, adjust settings and re-fly affected areas before leaving the site. Take notes on unusual conditions like shading or process upsets to help analysts avoid misinterpreting the data later.
Keep detailed records. Document everything - flight logs, site maps with flight paths, checklists, environmental conditions, and any deviations from standard procedures. Store thermal data and imagery in a structured repository, tagged by asset ID and inspection date. Platforms that support multi-format data and spatial visualization make it easier to connect findings to their physical context and streamline follow-up actions like generating work orders.
sbb-itb-ac6e058
Processing and Interpreting Thermal Data
Once the drone lands, the next step is to turn the thermal data into actionable insights.
Post-Flight Data Processing Workflows
Start by ensuring the quality of the data. Check for issues like blurry images, sun glare, or dropped frames, making sure to review each asset at least twice for redundancy.
Next, stitch the thermal images into a georeferenced radiometric orthomosaic. This step is crucial because it preserves absolute temperature values for every pixel, enabling precise calculations of temperature variations - not just general "hot" or "cold" spots.
To add context, overlay high-resolution RGB imagery on the thermal map. This provides clear GPS coordinates and visual details, making it easier to pinpoint areas needing attention.
Set temperature thresholds to automatically flag anomalies. Use absolute thresholds, like a maximum surface temperature of 180°F for specific components, and relative thresholds, such as a 15°F difference compared to surrounding areas. These automated checks save hours of manual work and ensure findings align with manufacturer specifications and operational standards.
For large solar farms, these automated workflows can significantly cut inspection times. Traditional electrical methods might take hours per megawatt, but drone-based thermal surveys can bring this down to about 10 minutes per megawatt while still capturing detailed, panel-level data. This approach also reduces inspection costs by approximately 40% compared to manual methods, thanks to lower labor demands and minimized downtime.
Platforms that handle multiple data types - like 3D models, RGB, thermal, LiDAR, and orthomosaics - make this process even more efficient. For example, Anvil Labs integrates radiometric thermal imagery with other datasets, allowing teams to overlay thermal data on 3D facility models. This setup simplifies annotation, measurement, and secure sharing across devices. With centralized storage, engineers, technicians, and managers can collaborate seamlessly, using the same processed data to interpret anomalies and plan interventions without juggling multiple tools.
With a fully processed thermal map in hand, the next step is to assess and prioritize the anomalies.
Classifying and Prioritizing Anomalies
Once the data is processed, the focus shifts to efficiently classifying anomalies for timely maintenance. The key is to separate critical faults from minor thermal variations using Delta T thresholds and contextual analysis. For example, critical issues often present as localized hotspots, like a blown fuse or a faulty solar cell, while benign factors such as sun glare create uniform patterns.
Delta T thresholds are a standard tool for identifying genuine problems. For solar panels, the IEC TS 62446-3 standard specifies that a module is flagged if its temperature exceeds the array average by 15–20°F. For electrical systems, overheating components like transformers or fuses typically trigger alerts when temperatures rise 10–20°F above normal operating ranges.
Different types of asset failures leave distinct thermal signatures. For instance:
- Overheating electrical components show as sharp, localized hotspots.
- Faulty solar modules or cells appear as isolated warm areas, while string outages form cooler, linear patterns across multiple panels.
- Diode failures or potential-induced degradation (PID) create irregular hotspots or "snail trail" patterns, often linked to moisture or stress.
- Delamination and micro-cracks show up as diffuse warm regions, indicating compromised panel encapsulation.
- Soiling and shading result in cooler patches, while vegetation encroachment casts warm shadows along array edges.
AI-driven segmentation is increasingly used to automate this classification process. Advanced algorithms analyze thermal data against fault profiles and specifications, flagging issues without manual intervention. These systems can also distinguish between genuine problems and environmental effects, like sun glare or shading, reducing false positives and speeding up analysis.
When interpreting anomalies, always consider the environmental and operational context. Factors like sun angle, wind speed, and recent load changes can influence temperatures. For example, a transformer appearing hot at midday might be normal due to solar exposure, but the same temperature at night could signal a serious issue. Understanding these nuances helps avoid misclassifications.
A practical classification framework combines temperature analysis with asset importance. Here's a simple guide:
| Classification | Temperature Criteria | Action Required |
|---|---|---|
| Normal | Within specs; Delta T < 10°F | Continue routine monitoring |
| Watch | 10–20°F above normal or neighbors | Inspect within 30 days |
| Maintenance Recommended | 20–40°F above normal; non-critical | Repair within 7–14 days |
| Urgent | > 40°F above normal; critical asset | Immediate shutdown and repair |
Adjust these thresholds based on manufacturer guidelines, asset importance, and historical data. For example, a 50°F overheat on a key transformer requires urgent action, while a 10°F rise on a less critical component may only need scheduled maintenance.
Export detailed reports that maintenance teams can act on immediately. Include key details like asset ID, GPS location, fault type, temperature metrics (in °F), and recommended actions. These reports can be directly integrated into maintenance management systems (CMMS) or task tools. Georeferenced thermal maps also allow crews to locate problem areas quickly using GPS, avoiding the need to manually search through rows of similar equipment.
After repairs, conduct follow-up flights to confirm that temperatures have returned to normal. Save these before-and-after thermal maps in a centralized system to validate the effectiveness of repairs and refine thresholds over time. Regularly archived thermal inspections - conducted quarterly, for instance - can uncover slow-developing issues like degradation, soiling, or vegetation encroachment. This enables predictive maintenance instead of reactive fixes.
Routine drone thermography in industrial settings helps detect problems like blown fuses, loose connections, and overloaded circuits early, preventing costly failures that could result in thousands of dollars in lost production. By maintaining a historical archive of inspections, organizations can identify trends - such as recurring issues in specific equipment or seasonal variations - and use this data to improve maintenance strategies and plan capital investments.
This streamlined approach to processing and analyzing thermal data helps U.S. industries minimize downtime and control maintenance expenses effectively.
Integrating Thermal Data into Digital Workflows
Once thermal anomalies are detected, the next step is to bring all related data into a single platform. By centralizing thermal images, radiometric data, RGB imagery, LiDAR scans, and inspection notes, teams can visualize, analyze, and act on insights more effectively.
Hosting and Analyzing Inspection Data
To make data integration seamless, standardizing file formats and naming conventions is crucial. A well-organized platform categorizes datasets by site, date, and asset ID, while also incorporating team-specific access controls. For U.S.-based facilities, metadata like timestamps, GPS coordinates, and inspection types should align with existing asset registries, ensuring every thermal anomaly is tied to a specific piece of equipment.
The real power of centralized platforms lies in multi-layer visualization. By supporting multiple data types, these platforms allow thermal layers to be overlaid on spatial contexts such as 3D meshes, LiDAR-derived digital twins, or 360-degree photos. This enables users to virtually "walk" through a site, toggle thermal overlays for specific dates, and quickly locate faults across large facilities.
Take Anvil Labs, for example. This platform integrates 3D models, thermal imagery, 360 panoramas, LiDAR point clouds, and orthomosaics into a single system. Users can move seamlessly between thermal views, 3D geometry, and panoramic imagery, all while maintaining consistent asset labels and coordinates. For instance, clicking on an asset in a 3D scene instantly pulls up its historical thermal inspections, lets you compare time-series data, and tracks temperature trends to support condition-based maintenance.
Annotation and measurement tools make thermal data actionable. Inspectors can highlight hotspots, suspected leaks, or insulation issues directly on thermal images or 3D views. They can also attach notes, assign severity levels, and designate team members for follow-up tasks. These annotations are linked to specific asset locations, making them easy to reference.
Versioning and tagging further enhance the process by helping teams monitor how anomalies change over time. This supports compliance documentation and ensures issues are prioritized and resolved according to internal standards.
Role-based access ensures that internal teams retain full control while limiting external views to relevant assets. Logging all views or modifications adds an extra layer of security. Instead of sharing raw files via email or USB drives, browser-based viewers with controlled download options offer a safer and more efficient way to collaborate across teams.
Anvil Labs also provides cross-device accessibility. Inspectors can review thermal data on tablets or phones while in the field, add follow-up notes, and close work orders directly at the asset location. This level of integration speeds up repairs, with users reporting inspections that are 75% faster and the ability to identify 30% more defects compared to older methods - saving some organizations hundreds of thousands of dollars.
Centralizing data not only simplifies analysis but also sets the stage for smoother integration into maintenance workflows.
Improving Maintenance Workflows with Thermal Data
Once centralized, thermal data can be seamlessly integrated into maintenance processes, boosting efficiency. Every detected anomaly should be geo-referenced and linked to a unique asset ID, such as a transformer number, panel string ID, or pump tag, based on the site's asset hierarchy or digital twin.
When platforms host both spatial models and asset metadata, clicking on a hotspot can reveal critical details like the asset's operating history, criticality ranking, last inspection date, and prior work orders. This context is invaluable for planning repairs.
Turning findings into work orders becomes straightforward with integrated systems. Anomalies can be classified by severity and failure mode, then exported as structured reports (e.g., CSV or JSON files containing asset ID, GPS coordinates, temperature deltas in °F, and recommended actions) or synced via API to CMMS or EAM systems. This ensures maintenance teams receive work orders with precise location details, visual evidence, and safety notes.
Anvil Labs supports direct integration with task management and maintenance platforms, streamlining the routing of issues to the appropriate teams. The platform can also sync asset hierarchies - such as plant → line → equipment - so that drone-detected anomalies are automatically linked to the correct asset records.
Automated alerts based on temperature thresholds and delta-T rules can further reduce manual effort. For example, set alerts for transformers running 40°F above normal or solar panels with a delta-T exceeding 20°F compared to their neighbors. This ensures critical issues are flagged immediately without needing constant image reviews.
Role-specific dashboards simplify decision-making. Managers can access high-level risk summaries, engineers get detailed anomaly lists with imagery, and technicians receive geo-located work views for repairs. Some operators even integrate live thermal video and telemetry into SCADA or cloud dashboards, enabling near-real-time hotspot detection and preemptive action.
Recurring inspections are key to predictive maintenance. By conducting regular thermal scans - quarterly or monthly - teams can build time-series records that highlight emerging issues, such as worsening hotspots or recurring insulation failures. Platforms that compare new thermal data with previous campaigns make it easier to spot trends and address problems before they escalate.
Advanced analytics can identify patterns like rising temperatures or seasonal variations, helping reliability engineers fine-tune maintenance schedules, adjust spare parts inventories, and justify equipment upgrades with quantifiable data. Facilities that incorporate thermal imaging into predictive maintenance often experience fewer unexpected failures.
For U.S. operations, platforms must use °F and feet while ensuring export formats meet local engineering and compliance standards. This makes it easier to share inspection data with regulators, insurance providers, and contractors while maintaining security protocols.
Key metrics to track include reduced unplanned downtime (in hours per year), mean time to repair, the number of failures prevented, inspection time per asset, and cost savings compared to traditional methods. Additional insights - like the percentage of anomalies converted into work orders or the time from detection to resolution - show how well thermal data is integrated into daily maintenance decisions.
Anvil Labs users have achieved ROI within two months, compressing the time from data capture to action from days to hours. This enables near-real-time interventions, significantly improving outcomes for critical assets.
Conclusion
Thermal drones are reshaping the way asset inspections are conducted, making it easier to spot overheating components, leaks, and insulation issues before they escalate into costly outages or safety hazards. This proactive approach shifts the focus from reactive repairs to preventive maintenance, improving uptime, enhancing worker safety, and keeping costs in check.
The real power of thermal drones emerges when paired with integrated digital workflows. Radiometric thermal sensors provide precise temperature readings for every pixel, while GPS-guided autonomous flights ensure consistent and thorough coverage. Add AI-driven analysis to the mix, and anomalies can be automatically classified and flagged for potential failure risks. However, without a centralized system to manage this data, even the most detailed thermal images risk being disconnected from actionable maintenance decisions.
Platforms like Anvil Labs bridge this gap by consolidating thermal imagery with 3D models, LiDAR scans, 360° photos, and orthomosaics into a unified digital twin. This setup allows teams to click on an asset and instantly access its thermal inspection history, compare temperature changes over time, and annotate hotspots with notes or severity ratings. Inspectors can review findings in the field and finalize work orders directly at the site, thanks to cross-device accessibility. By integrating AI analysis tools and task management systems, these platforms convert thermal data into automated alerts, streamlined dashboards, and connected work orders, speeding up the process from detection to repair.
The results speak for themselves: organizations report inspections that are 75% faster, a 30% increase in defect detection, and notable cost savings compared to traditional methods. These improvements stem not just from using drones but from creating repeatable inspection routines, establishing temperature thresholds for automated alerts, and maintaining time-series data to support predictive maintenance and trend analysis.
For facilities looking to adopt thermal drone inspections, a step-by-step approach is key. Start with a pilot program targeting critical assets like switchgear, transformers, motors, pipelines, or solar arrays - where failures can have significant financial or safety implications. Choose a radiometric thermal payload and an industrial-grade drone suited to your specific temperature ranges and site conditions. Plan inspection routes around existing maintenance schedules, and select a data platform that centralizes inspection data while integrating with your CMMS or EAM systems. As early successes highlight the value of this approach, scale the program across your site and fine-tune workflows based on initial lessons.
Thermal drones don’t replace expert judgment - they enhance it. By delivering precise data and integrating seamlessly into digital workflows, they enable faster, more informed maintenance decisions. The true long-term benefit isn’t just in the images; it’s in the smarter, data-driven decisions that improve reliability and reduce risks over time.
FAQs
How do thermal drones enhance industrial inspections for better efficiency and safety?
Thermal drones are transforming the way industrial inspections are conducted. These high-tech tools can quickly and precisely identify problems like overheating machinery or leaks, cutting down on the time and effort required compared to older, manual methods. Plus, they significantly lower safety risks by reducing the need for workers to perform potentially hazardous tasks.
Equipped with advanced thermal imaging, these drones can spot issues that might go unnoticed by the human eye. This means companies can address potential failures early, saving on repair costs and avoiding unexpected downtime. The result? A more efficient operation and a safer work environment, all while keeping expenses in check.
What should I look for when choosing a thermal drone and sensor for industrial inspections?
When choosing a thermal drone and sensor for industrial inspections, several factors play a crucial role in ensuring accurate and reliable results. Start with thermal resolution - higher resolution sensors are better at detecting even the smallest temperature differences, offering more detailed and precise imaging. Equally important is the temperature range of the sensor, as it determines its ability to handle the extreme temperatures often encountered in industrial settings.
Next, take a close look at the drone's flight capabilities. Features like extended battery life, stable flight performance, and long-range operation are essential for covering large areas and tackling tough environmental conditions. Also, think about the integration of data processing tools. Compatibility with platforms like Anvil Labs can be a game-changer, offering advanced features such as 3D modeling, thermal image analysis, and secure data-sharing options. These tools not only simplify inspections but also help you quickly pinpoint potential asset issues.
How do thermal drones help identify equipment issues and improve maintenance planning?
Thermal drones are equipped with cameras designed to detect heat patterns, making them invaluable for spotting issues like overheating machinery, leaks, or insulation problems. These drones capture detailed thermal images, revealing anomalies that would otherwise go unnoticed, allowing teams to tackle problems before they grow into costly repairs.
When thermal data is integrated into digital workflows, it transforms maintenance processes. Combining tools like 3D models with thermal imagery enables precise analysis, leading to quicker and more accurate decisions. This not only boosts asset reliability but also cuts down on downtime and reduces the risks associated with unexpected failures.
