Drone photogrammetry turns aerial images into 3D models, maps, and measurements. Accuracy is key for tasks like construction monitoring, volume calculations, and infrastructure inspections. Here's a quick breakdown:
- Accuracy Metrics: Root Mean Square Error (RMSE) and Ground Sampling Distance (GSD) are critical for measuring precision. RTK/PPK systems and Ground Control Points (GCPs) can improve accuracy to less than 0.5 inches.
- Key Tools:
- RTK/PPK GNSS for precise positioning
- GCPs for aligning models to real-world coordinates
- Photogrammetry software like Pix4D or DroneDeploy for processing data
- Best Practices:
- Ensure 70–80% image overlap for better stitching.
- Fly during overcast conditions or midday to minimize shadows.
- Use multi-flight redundancy to avoid distortions.
- Validation: Use GNSS tools and RMSE calculations to confirm model accuracy. Proper validation ensures reliable results for orthomosaics and elevation models.
How to Assess the Accuracy of Your Drone Mapping? (YDQA EP 116)
Tools for Accurate Drone Photogrammetry
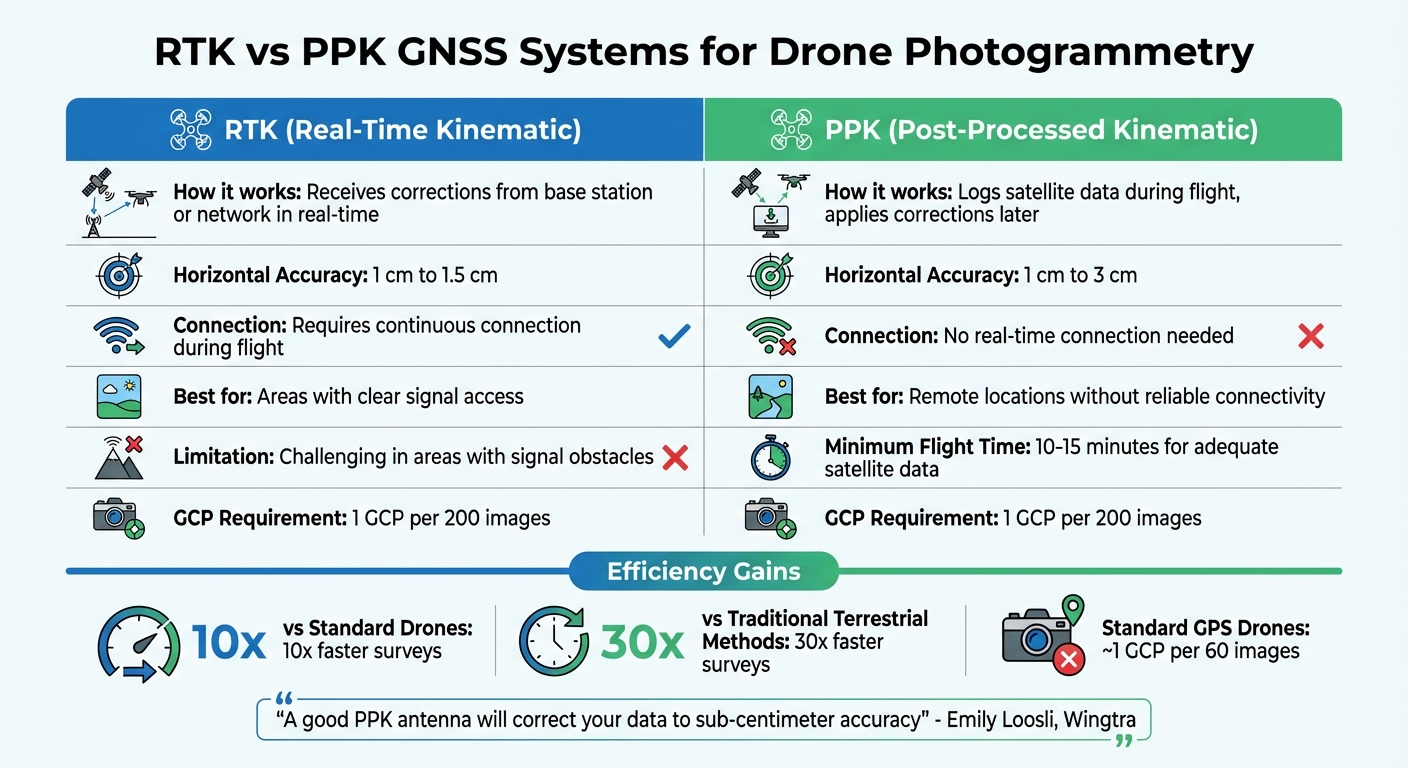
Drone Photogrammetry Accuracy Tools Comparison: RTK vs PPK GNSS Systems
RTK/PPK GNSS for Better Positioning
RTK and PPK systems are game-changers when it comes to improving drone positioning by correcting satellite errors. RTK systems work in real time, receiving corrections from a base station or network, and can deliver horizontal accuracy ranging from 1 cm to 1.5 cm. However, these systems need a continuous connection, which can be tricky in areas where obstacles block signals. On the other hand, PPK logs satellite data during the flight and applies corrections later, offering accuracy between 1 cm and 3 cm. This method is particularly reliable in remote locations.
Emily Loosli from Wingtra states, "A good PPK antenna will correct your data to sub‑centimeter accuracy".
For effective PPK processing, flights should last at least 10 to 15 minutes to gather enough satellite data.
RTK/PPK technology significantly enhances efficiency, speeding up surveys by as much as 10 times compared to standard drones and 30 times compared to traditional terrestrial methods. Additionally, while standard GPS drones might need around one ground control point (GCP) for every 60 images, RTK-enabled drones often require just one GCP for every 200 images. Many market-leading RTK-enabled drones are now available, making this technology more accessible than ever.
Accurate ground control through well-placed markers further strengthens your model's alignment with real-world coordinates.
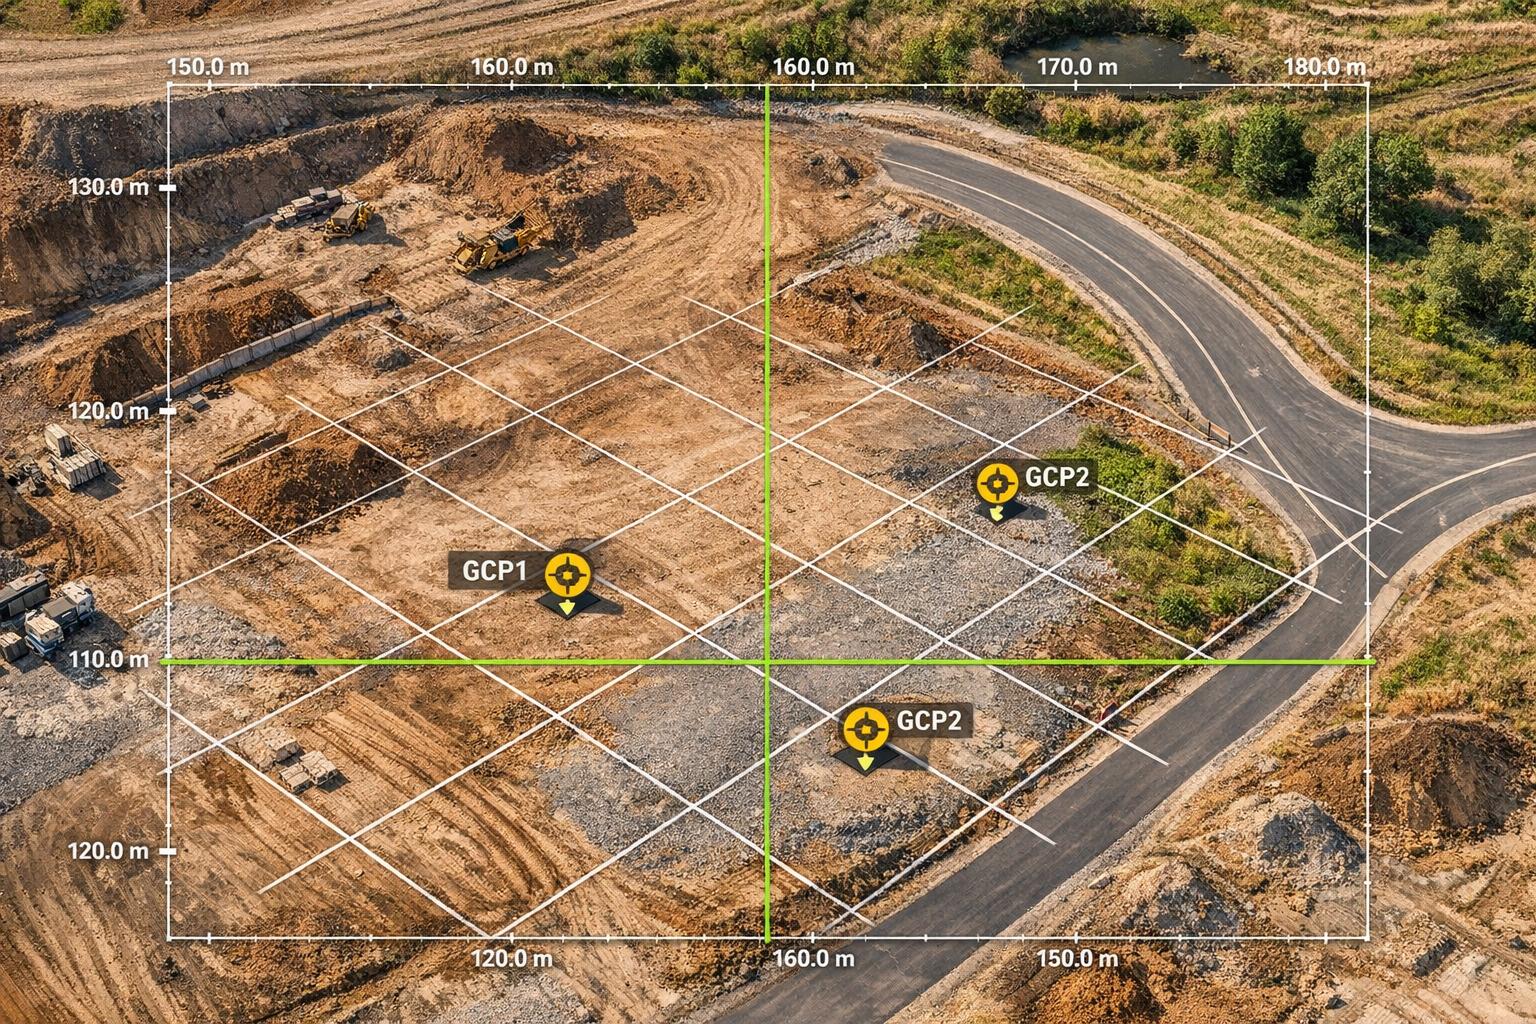
Ground Control Points (GCPs) and Checkpoints
Ground Control Points (GCPs) are physical markers used to align your digital model with real-world coordinates. These markers are typically placed using survey-grade equipment like total stations or GNSS receivers. To ensure accuracy, distribute GCPs evenly across the site, including the project’s perimeter, and use independent checkpoints to validate the final results. Even with RTK or PPK drones, checkpoints are essential to confirm that your model meets the required error tolerances.
For best results, GCP targets should be 5 to 10 times larger than your Ground Sampling Distance (GSD). For instance, if your GSD is 2 cm, your target sizes should be between 10 and 20 cm. Place GCPs on flat, stable surfaces, and ensure they are at least 50 feet away from tall obstacles to avoid shadows and signal issues.
Photogrammetry Software Options
After capturing data with enhanced positioning and properly distributed GCPs, photogrammetry software takes center stage in turning this data into precise models. The right software can transform your drone images into 3D models, orthomosaics, and point clouds. Top platforms are designed to support RTK and PPK data, correct rolling shutter distortions, and calculate metrics like RMSE to ensure accuracy.
Pix4Dmapper is a popular option, offering customizable tools for processing orthomosaics and digital surface models. DroneDeploy, a cloud-based platform, integrates BIM and CAD overlays and provides cut/fill analysis, making it particularly useful for construction and earthworks.
Simon Roberts from Laing O'Rourke explains, "DroneDeploy is providing survey‑grade data to every member of our project team, and now with BIM models... every member is seeing the benefit".
Other platforms cater to specific needs. For example, Agisoft Metashape is favored for its multispectral capabilities, making it ideal for agriculture and environmental monitoring. Propeller, on the other hand, is widely used in mining and construction projects due to its support for local grid coordinates. When choosing photogrammetry software, look for features like built-in measurement tools, CAD/BIM integration for comparing as-built data to designs, and detailed quality reports that verify camera parameters and RMSE metrics.
Dan Wawrzyn from Propeller puts it, "A 3D model is no more or less accurate than the data used to generate it".
Best Practices for Data Collection
Flight Planning and Image Overlap
Getting the right image overlap is key to creating accurate models. A standard overlap of 70–80% helps the software find matching points between photos, ensuring seamless stitching and avoiding blank areas in the final output. For more complex terrains, bump this overlap up to 80–83% so the software has enough data to work with.
Your flight altitude also plays a big role in image quality. Flying at a height 3–4 times the tallest object in the area lowers the Ground Sampling Distance (GSD), which improves resolution and accuracy. For complete 3D reconstructions, aim for a 60% nadir overlap combined with a 70–80% cross-grid overlap at a 45° angle.
Motion blur can ruin your images, so use "Stop and Capture" modes or keep your speed under 16 feet per second (5 m/s). If you’re using a drone with adaptive speed, it can automatically adjust based on lighting to prevent blur during continuous flights.
For consistent image quality, stick to manual exposure settings. Automatic exposure adjusts to lighting changes, which can create inconsistencies and make it harder for the software to match features. When mapping structures with varying heights, use ground offset to account for the tallest points - this helps tighten your mapping profile and improves accuracy.
Choosing the Right Environmental and Lighting Conditions
Timing and weather make a huge difference in data quality. Overcast skies with stratus clouds are ideal because diffused light reduces shadows and reflections, which can distort your model or leave gaps in your data. If you’re flying on a sunny day, plan your mission between 10:00 AM and 2:00 PM when the sun is directly overhead to minimize long shadows.
"Stratus cloud cover is the best lighting condition as there are usually no deep shadows, but still adequate lighting for images." - Hexagon Geosystems Blog
Wind speed also affects image sharpness. Even if your drone can handle strong winds, ground wind speeds over 19 mph (8 m/s) can degrade image quality. And don’t fly in rain, snow, or high humidity - water on the lens blurs images, and moisture can alter how surfaces appear.
Consistency is key for lighting conditions. Sudden changes during your flight can cause uneven coloring in your final orthomosaic, making it harder for software to align images. Use manual focus set to near infinity for sharper photos, and avoid autofocus during the flight.
Multi-Flight Data Redundancy
Capturing the same area from multiple angles is essential to avoid reconstruction bias. If features are only photographed from one side, your model may end up with distortions or inaccuracies. For detailed 3D structures like industrial sites or highwalls, use cross-hatch flight patterns - fly the area twice at perpendicular angles to gather maximum detail from all perspectives.
"The reconstruction is created from overlapping images so it may be biased or inaccurate if a feature is only captured from one side." - Pix4D
Multi-flight redundancy is also crucial for tracking changes over time. When revisiting a site, align new datasets with a reference model, such as a point cloud (.laz file) or digital elevation model (.tif file) from your first flight, to ensure consistency in monitoring progress.
For large-scale projects with over 1,000 images, break your dataset into smaller chunks of about 250 images each. Start by processing the first chunk to create a master Digital Surface Model (DSM), then use that DSM to align and process the remaining chunks. This method avoids vertical drift and alignment issues, ensuring a seamless final model. Always extend your flight boundaries slightly beyond the area of interest to capture enough overlapping images for accurate edge reconstruction.
sbb-itb-ac6e058
Accuracy Assessment and Validation Techniques
Using GNSS Tools for GCP and Checkpoint Validation
When it comes to validating model accuracy, high-precision GNSS receivers are your go-to tools. These survey-grade devices record the X, Y, and Z coordinates of ground markers, anchoring your drone imagery to real-world positions. It’s important to note the distinction between Ground Control Points (GCPs) and Checkpoints: GCPs are used during the processing and georeferencing stages, while Checkpoints remain independent to assess absolute accuracy.
To validate your data, use RTK or PPK GNSS equipment to capture independent coordinate data on-site. This data, typically stored in formats like CSV or JXL, can then be imported into your photogrammetry software. From there, link each coordinate to its corresponding pixel in the imagery - either manually or using automated tools. After processing, compare the GNSS-measured coordinates with the model-derived ones to calculate residuals (dX, dY, dZ). Keep a close eye on reprojection error; if it exceeds 1 pixel, adjustments to image link positioning may be required.
For effective validation, distribute at least 5 GCPs and checkpoints across the project area, ensuring coverage of both high and low elevations. Larger projects might need 8–10 points. Place markers at least 50 feet from the flight plan perimeter, ensuring each marker appears in at least 5 images to support triangulation. Professional-grade accuracy typically targets residuals under 0.1 meters (about 4 inches). Achieving this level of precision allows for a deeper error analysis using RMSE.
Calculating RMSE for Accuracy Metrics
Once you’ve validated coordinate points with GNSS tools, the next step is to quantify model errors using Root Mean Square Error (RMSE). RMSE measures the difference between the points in your photogrammetric model and independently measured ground points. This calculation is essential for identifying and quantifying discrepancies.
To ensure accuracy, use checkpoints from a source with higher precision than your aerial system, and keep them separate from the points used during model production. Horizontal (X, Y) and vertical (Z) accuracy should be calculated independently, as factors like vegetation can impact them differently. Modern photogrammetry software typically automates RMSE calculations by comparing checkpoint coordinates with model-derived positions.
With proper ground control and uncalibrated 20MP cameras, professional systems can achieve RMSE accuracies of about 0.1 foot (approximately 3 cm). Using an RTK drone in combination with GCPs can further improve absolute accuracy to less than 0.5 inches. Always review your software’s processing report to ensure that checkpoint errors fall within the acceptable range for your project. This metric complements earlier GCP placement strategies and strengthens the overall reliability of your model.
Validating Orthomosaics and DEMs
For professional projects, validating both horizontal and vertical accuracies in orthomosaics and DEMs is essential. Building on previous validation steps, follow ASPRS standards to confirm positional accuracy. Horizontal accuracy for orthomosaics is assessed using randomly distributed checkpoints, while vertical accuracy for DEMs requires dedicated vertical checkpoints. Residual analysis - comparing surveyed positions to those calculated in your model - is the foundation of this process.
Tools like the GCP Manager in ArcGIS Pro can help calculate RMSE and generate adjustment reports. For unbiased validation, provide approximate checkpoint locations, allowing operators to identify features in the imagery without prior knowledge. This approach ensures that residual analysis is applied objectively to orthomosaics and DEMs.
To produce high-quality elevation data, ensure an image overlap of at least 80% forward and 60% side. After processing, review the "Residual Overview" section in your software to confirm RMSE values meet your project’s requirements.
"Combining high-accuracy mapping with the latest overlay tools… allows us to continue to minimize the gap between design and reality." – Rob Havins, Director - Integrated Construction, Bartlett Cocke
Advanced Tips for 3D Model Precision
Tackling Errors with Bias Correction
Even with high-quality tools, errors can creep into your 3D models due to GNSS inaccuracies, camera miscalibration, or uneven lighting that disrupts feature matching. These issues often manifest as consistent offsets in your X, Y, or Z coordinates - like a vertical "doming" effect.
To pinpoint these biases, calculate the RMSE (Root Mean Square Error) on your checkpoints and look for patterns of directional error. Software like Pix4D or Agisoft Metashape can help refine camera positions and orientations through bundle adjustment. If GNSS errors are the culprit, applying RTK or PPK post-processing with CORS base station data can bring positioning errors from the meter level down to centimeters.
A practical approach to correction involves measuring residuals on Ground Control Points (GCPs) and applying affine transformations to adjust your model. For instance, scaling Z-values to fix a 4-inch vertical bias can reduce error to less than 0.75 inches. Proper camera calibration also plays a critical role - whether you calibrate pre-flight using a pattern or rely on self-calibration with high-overlap, multi-angle imagery. This process eliminates lens distortion and stabilizes bundle adjustment, preventing systematic deformation in your point clouds. These refinements are essential for achieving sub-inch accuracy in your 3D models.
Once biases are corrected, make sure your refined models are accessible to your team for review and further analysis.
Managing and Annotating Models with Anvil Labs

After correcting model biases, focus on how you manage and share your data. Platforms like Anvil Labs allow you to host orthomosaics, point clouds, and 3D meshes, ensuring your refined models are available to your entire team. The platform’s annotation tools let you flag specific areas directly on the model - for example, drawing polygons around biased regions in a DEM or marking features that need reprocessing.
Anvil Labs also offers precise measurement tools for distances, areas, and volumes, making it easier to validate results against GCP standards. For example, if your goal is sub-0.75 inch accuracy, you can measure a stockpile's volume before and after bias correction, then overlay GCP checkpoints to confirm improvements. The platform supports a variety of data types, including LiDAR, thermal imagery, and orthomosaics. With integrations for AI-based bias detection, Anvil Labs even enables virtual site assessments and progress tracking, reducing the need for frequent physical surveys.
Real-Time Collaboration Across Devices
Centralized hosting is only part of the equation - real-time collaboration takes precision to the next level. Anvil Labs allows for seamless cross-device access, enabling field engineers to review models on tablets or smartphones while on-site. This means they can quickly verify that structures, elevations, and clearances match real-world conditions. If they spot an issue, they can annotate it immediately and trigger a targeted re-flight, avoiding delays that might arise from discovering problems back at the office.
The platform also includes role-based access controls, so surveyors can lock critical geometry while stakeholders add contextual information. Real-time syncing ensures that field teams can mark GCP discrepancies on mobile devices while analysts address them on desktops. This collaborative workflow has proven to significantly reduce error detection time - some teams have cut project turnaround from days to just hours, all while maintaining sub-1 inch accuracy.
Additionally, integrations with task management systems ensure that flagged anomalies - like misaligned pipes or distorted rooflines - automatically generate actionable review tasks tied to specific 3D locations. This continuous feedback loop transforms your 3D models into dynamic quality control tools, rather than static deliverables. By enabling rapid detection and resolution of issues, this approach ensures accuracy at every stage of your project.
Conclusion
Summary of Tools and Tips
To achieve centimeter-level accuracy in your projects, focus on combining the right tools, techniques, and practices. Start with PPK or RTK GNSS receivers to streamline workflows and reduce the need for multiple Ground Control Points. Modern systems can now deliver absolute accuracy down to 3 cm (0.1 ft). Pair these receivers with high-resolution sensors - ranging from 45MP to 61MP full-frame cameras - to improve Ground Sample Distance (GSD).
For optimal results, maintain an image overlap of 60–70% and avoid flying in winds above 8 m/s (19 mph) to minimize distortions. Plan flights during times of the day when lighting conditions reduce harsh shadows, which can distort orthomosaic outputs. Always validate accuracy using independent checkpoints to ensure reliable results.
Address systematic errors like vertical doming by applying bias corrections. Calculate RMSE (Root Mean Square Error) on checkpoints, refine residuals with affine transformations, and improve camera calibration using bundle adjustments. After correcting your models, platforms like Anvil Labs allow you to host, annotate, and measure 3D data with precision. These tools not only validate volumes, distances, and elevations against GCP standards but also enable seamless collaboration between field and office teams. This integration reinforces the accuracy achieved earlier in the process and ensures high-quality deliverables every time.
Next Steps for Professionals
To modernize your workflow, consider these actionable steps based on the techniques outlined above. If you're still relying on traditional methods, transitioning to professional photogrammetry can deliver immediate returns. As Andrew Milanes, President of Environmental Science Services, Inc., explains:
"I would say that you'll start seeing an ROI immediately. I mean, this is not a consumer hobbyist drone. This is a professional, technical piece of equipment".
The efficiency gains are substantial - up to 30 times faster than terrestrial methods - making the investment worthwhile for most industrial applications.
Take a moment to evaluate your current processes. Are you spending hours setting up GCPs? Consider upgrading to PPK systems. Are wind or shadows affecting your data quality? Tighten your environmental monitoring protocols. Are errors only discovered after significant delays? Platforms like Anvil Labs can help by enabling field teams to annotate issues in real time on mobile devices, allowing for immediate re-flights if necessary. By adopting these tools and strategies, you’ll transform your 3D models from static deliverables into dynamic assets that deliver sub-inch accuracy at every stage of your projects.
FAQs
What’s the difference between RTK and PPK for improving drone photogrammetry accuracy?
RTK (Real-Time Kinematic) is a technology that delivers GPS corrections while the drone is actively flying, achieving real-time accuracy down to the centimeter. This makes it an excellent choice for tasks that demand both precision and immediate results.
PPK (Post-Processed Kinematic), in contrast, collects raw GNSS data during the flight but applies the corrections later, during post-processing. While PPK matches RTK in terms of accuracy, it requires extra time and effort to process the data after the flight.
Both approaches are reliable and precise. Deciding between them depends on factors like your project's specific requirements, deadlines, and preferred workflow.
How should I place Ground Control Points (GCPs) to improve the accuracy of drone photogrammetry models?
Ground Control Points (GCPs) play a critical role in aligning drone imagery with real-world coordinates. They ensure precise horizontal accuracy down to centimeters and vertical precision within sub-inch levels in 3D models. To get the best results, proper placement is a must.
- Use enough GCPs: For smaller projects, you’ll need at least 4 GCPs, but most projects perform better with 5–10 points that are evenly spread out. A helpful rule of thumb: use 1 GCP for every 60 drone images if you’re not using RTK, or 1 for every 200 images if you are using RTK/PPK systems.
- Strategic distribution matters: Place GCPs at the corners of your project area, along its edges, and in spots with noticeable elevation changes. Adding one at the center can help minimize distortions in the interior.
- Prioritize visibility and stability: Opt for high-contrast targets, ideally around 20 × 20 inches, with a matte finish to avoid glare. Secure them firmly using stakes or weights, and ensure their exact coordinates are captured with an RTK-grade GNSS receiver.
After setting up, upload your GCP data to Anvil Labs’ platform. Their tools refine georeferencing and validate the accuracy of your data, helping ensure your drone models meet the highest precision standards.
Why is image overlap crucial in drone photogrammetry, and what are the recommended overlap percentages?
In drone photogrammetry, image overlap plays a crucial role in achieving accurate 3D reconstructions and dependable mapping. This overlap ensures that images share enough visual details, allowing the software to align them correctly. Without sufficient overlap, the final model may contain noticeable errors or inconsistencies.
To achieve the best results, aim for at least 70% overlap. Specifically, strive for 75% front overlap (front-lap) and 60–75% side overlap (side-lap). Many professionals prefer a 75% side-lap for more reliable data processing, as it enhances the precision and continuity of the reconstructed area.
