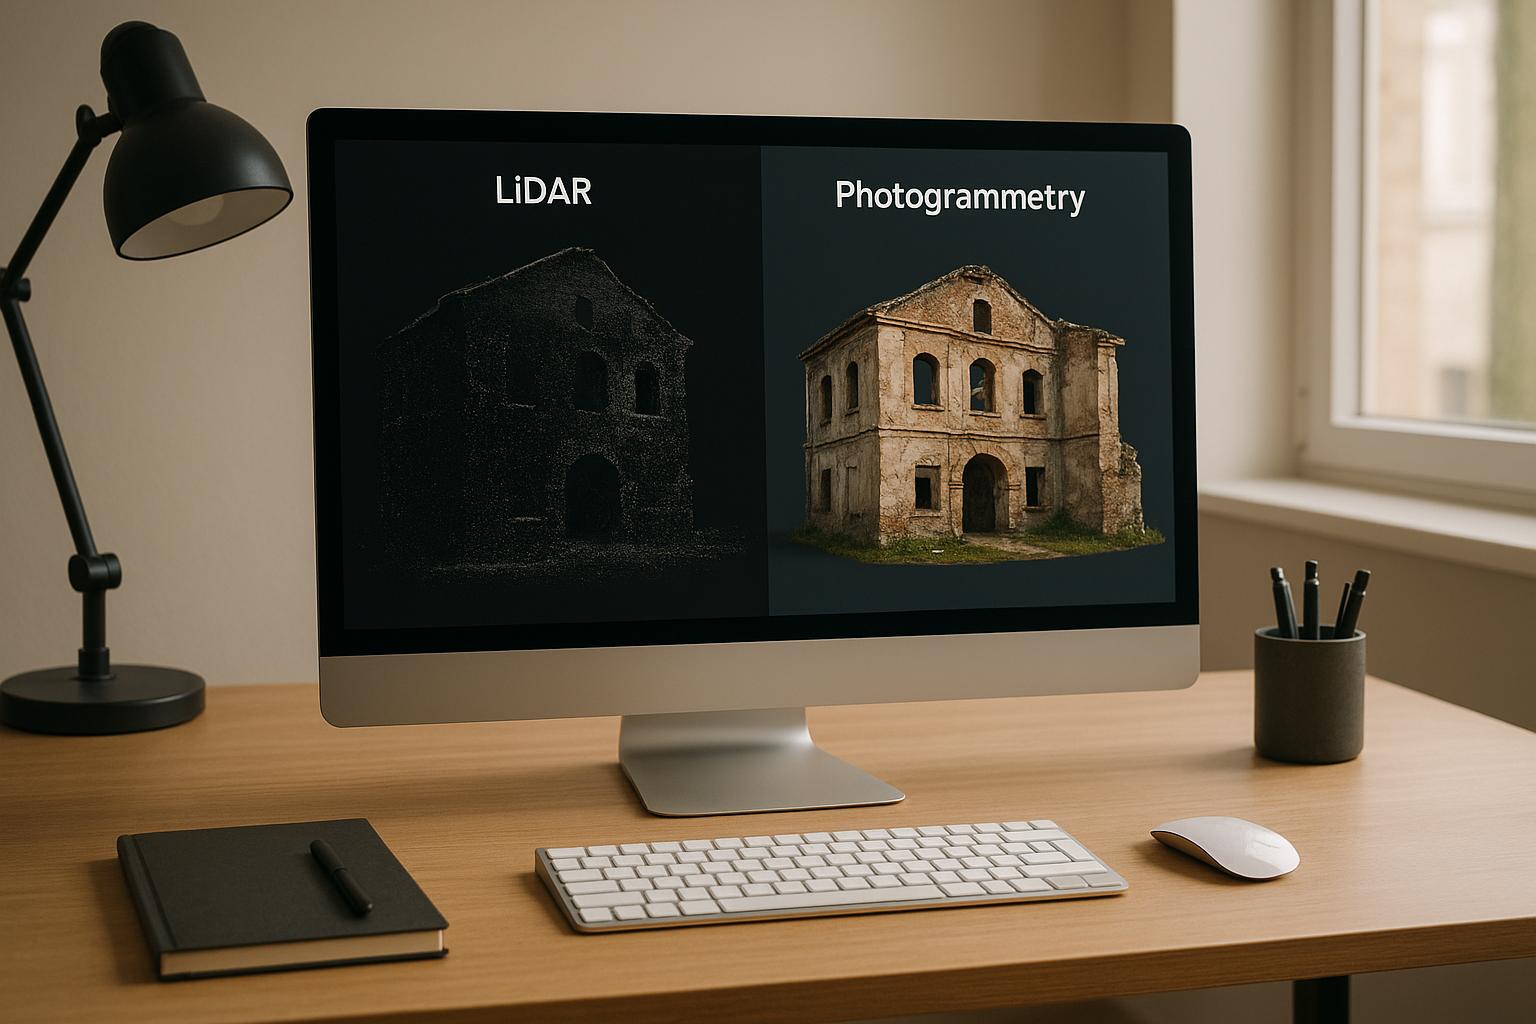
LiDAR and photogrammetry are two leading technologies for creating 3D models of physical spaces, each with distinct strengths. Here's what you need to know:
- LiDAR uses lasers to measure distances, offering high precision (1–3 cm vertical accuracy) and the ability to work in darkness or dense vegetation. It's ideal for large, complex terrains but comes with higher costs ($50,000–$350,000 for hardware, $300–$1,000/hour for service).
- Photogrammetry relies on overlapping images to reconstruct 3D models. It excels in capturing visual details and textures in well-lit areas, with lower costs ($2,000–$20,000 for hardware, $150–$500/hour for service) but slightly less vertical accuracy (2–4 cm).
Quick Comparison:
| Factor | LiDAR | Photogrammetry |
|---|---|---|
| Hardware Cost | $50,000–$350,000 | $2,000–$20,000 |
| Service Cost | $300–$1,000/hour | $150–$500/hour |
| Vertical Accuracy | 1–3 cm | 2–4 cm |
| Point Density | 50–200 points/m² | 5–20 points/m² |
| Operational Limitations | Works in darkness, penetrates vegetation | Needs good lighting, blocked by dense foliage |
Key Takeaway: Choose LiDAR for precision in complex, large-scale areas (e.g., forests, rugged terrains). Opt for photogrammetry when detailed visuals and cost efficiency are priorities (e.g., urban areas, small projects). Combining both technologies often provides the best results.
LiDAR vs Photogrammetry Key Differences
LiDAR Data Collection Protocols
Accurate LiDAR data collection depends on following precise protocols, which serve as a guide for industrial site managers to plan and execute their acquisition strategies effectively.
Hardware and Calibration Requirements
LiDAR systems rely on three core components to capture spatial data with precision. First, the laser ranging and scanning unit emits pulses and measures their return times. Next, an Inertial Navigation System (INS) tracks the sensor's position and orientation. Finally, a Global Navigation Satellite System (GNSS) receiver provides accurate geographic positioning.
The performance of these components directly influences the accuracy of measurements. For instance, survey-grade tripod scanners can achieve accuracy levels of ±1–3 mm, while professional hybrid scanners reach around ±20 mm. Smartphone LiDAR systems, on the other hand, typically provide ±100–200 mm accuracy. High-end sensors can deliver horizontal accuracies of 0.4 inches and vertical accuracies of 0.8 inches.
Calibration is a critical step to ensure the accuracy of 3D point clouds. This involves aligning the laser, GNSS, and IMU. Intrinsic calibration focuses on the internal parameters of the sensor, such as aligning the laser beam using targets with predefined dimensions. Extrinsic calibration ensures that LiDAR data integrates seamlessly with data from other sensors, like cameras. Even small calibration errors can distort the point cloud, impacting its accuracy. Additionally, adverse weather conditions - like rain, fog, or dust - can interfere with laser signals, causing scattering or absorption. Regular calibration checks are essential to maintain accuracy, especially under varying conditions.
Once the sensors are calibrated, the next step involves planning efficient data collection flights.
Flight Planning and Data Acquisition
Effective flight planning is about balancing cost efficiency with the desired data quality. The process starts by defining the Area of Interest (AOI) using KML files and determining the required point density (points per square meter) based on project needs. It’s also important to check FAA airspace restrictions using tools like LAANC and to review local regulations. Platforms like Google Earth Pro can help identify terrain features, vegetation, and potential obstacles, while weather forecasts should be monitored closely.
Flights typically follow a grid pattern with parallel lines, maintaining 20–30% overlap, at speeds of 13–18 mph to ensure adequate data density and stability. Unlike photogrammetry, LiDAR performs well in low-light conditions and can penetrate vegetation canopies, making it ideal for complex environments. A 2020 study by Alsadik and Remondino tested various LiDAR sensors, such as the Quanergy M8, Velodyne VLP-16, and Ouster OS-1-16, demonstrating how flying speed, altitude, and point density are interconnected. Terrain and vegetation also play key roles; rugged landscapes may require varying altitudes and complex flight paths, while dense vegetation often necessitates lower flying heights or multiple passes for sufficient ground coverage.
Post-Processing and Data Accuracy
Once data is collected, post-processing transforms raw point clouds into practical datasets. This begins with trajectory processing, where GNSS and IMU data are combined to pinpoint the sensor’s exact location throughout the flight. The raw data is then converted into a point cloud containing millions of 3D coordinates and intensity values.
Classification algorithms are used to distinguish ground points from vegetation and structures, enabling the creation of precise terrain models. Noise filtering eliminates errors caused by atmospheric conditions or reflective surfaces. Proper georeferencing is critical; inaccuracies in GNSS and IMU data can misalign the point cloud. One common challenge during this phase is boresight misalignment, which can introduce systematic errors.
To ensure quality, processed results are compared against known control points. When calibration and processing are done correctly, high-end systems consistently achieve horizontal accuracies of 0.4 inches and vertical accuracies of 0.8 inches. Point density can also be improved during post-processing by adjusting flight parameters. For example, reducing flight speed, lowering altitude, increasing pulse repetition rates, and enhancing lateral overlap all contribute to denser point clouds. However, these adjustments must be carefully balanced against flight time and data storage limitations.
Photogrammetry Data Collection Protocols
Photogrammetry uses high-resolution cameras and extensive image overlap to create detailed 3D models. This process depends on precise equipment setup, careful flight planning, and thorough image processing. Below, we’ll break down the key tools and georeferencing techniques essential for dependable photogrammetry.
Equipment and Georeferencing Needs
Unlike LiDAR, which uses active sensing, photogrammetry relies entirely on optical data. At its core are high-resolution cameras that capture detailed images, which are later converted into accurate maps and models.
The choice of drone plays a significant role and depends largely on the project’s scale and budget. Entry-level drones can cost between $500 and $2,000, while professional-grade systems range from $5,000 to $20,000. Fully equipped high-end setups typically fall in the $4,000–$13,000 range.
Georeferencing is handled using either Ground Control Points (GCPs) or advanced PPK/RTK systems. PPK (Post-Processed Kinematic) technology is often preferred for its reliability in GNSS data collection compared to RTK (Real-Time Kinematic). Both systems require RTK-enabled drones with onboard GNSS sensors and a base unit. The key difference lies in timing: RTK processes data in real time, while PPK processes it after the flight.
In construction, PPK workflows are particularly valued for their precision and adaptability. Martti Keskinen, Drone Manager at YIT, highlights why this method works better in certain scenarios:
"It's the accuracy of the AeroPoints that works for us – some companies rely on RTK but we do not, we want reliable, accurate results. Fixed ground control doesn't work for construction due to there always being material moved, and PPK workflows are not possible with a traditional fixed point."
Additional tools like flight planning software, spare batteries, and backup systems are also necessary for smooth operations.
Flight Planning and Image Overlap
One of photogrammetry’s most crucial requirements is achieving 60–90% image overlap during data collection. This overlap ensures that multiple images capture the same features from different angles, enabling accurate 3D reconstruction.
However, this high overlap requirement demands longer flight times, especially for large areas. Photogrammetry cameras typically have narrower fields of view compared to LiDAR, requiring more images and complex stitching to cover the same ground.
For large-scale surveys, speed becomes a limiting factor. Fixed-wing drones equipped with LiDAR can map up to 10 square kilometers in a single flight, whereas photogrammetry missions usually cover smaller areas per session.
Flight planning software is essential for determining and optimizing overlap settings based on project needs. Operators often need to adjust these settings in the field to maintain consistent front and sidelap coverage, particularly in challenging environments with tall structures or dense vegetation. Weather can also impact photogrammetry more than LiDAR, as good lighting is critical for capturing high-quality images. After image capture, extensive post-processing is required to ensure accuracy.
Post-Processing and Accuracy Challenges
Post-processing in photogrammetry involves turning a vast number of overlapping images into 3D models and orthomosaics. This process is resource-intensive and relies on specialized software to match features across images, calculate camera positions, and generate point clouds from the visual data.
The density of these point clouds influences the final model’s accuracy. Photogrammetric point densities typically range from 5 to 20 points per square meter, which is much lower than the 50 to 200 points per square meter that UAV-based LiDAR can achieve.
Processing large volumes of high-resolution images can take days or even weeks, making quality control a crucial step. Any issues like poor lighting, motion blur, or lack of texture can lead to gaps or inaccuracies in the final model. The overall accuracy of photogrammetry depends on factors like image overlap, proper camera calibration, and environmental conditions during data capture.
LiDAR vs. Photogrammetry Comparison
When comparing LiDAR and photogrammetry, the differences in how each collects and processes data play a major role in determining their suitability for various projects. LiDAR uses laser pulses to gather data, while photogrammetry relies on overlapping images to create 3D models. This core distinction shapes their operational strengths and limitations.
Protocol and Use Case Comparison Table
| Factor | LiDAR | Photogrammetry |
|---|---|---|
| Hardware Cost | $50,000 - $350,000 | $2,000 - $20,000 |
| Service Cost | $300 - $1,000 per hour | $150 - $500 per hour |
| Data Acquisition Speed | 1.8 million points per second | Slower, requires extensive overlap |
| Point Density | 50 - 200 points/m² | 5 - 20 points/m² |
| Horizontal Accuracy | Down to 1 cm | Down to 1 cm |
| Vertical Accuracy | 1 - 3 cm | 2 - 4 cm |
| Processing Time | Fast, automated workflows | Time-consuming, needs powerful computers |
| Environmental Limitations | Works in darkness, all weather | Needs good lighting conditions |
| Vegetation Penetration | Yes, through canopy gaps | No, blocked by dense foliage |
| Operator Expertise | Moderate, automated workflows | High, requires imaging expertise |
This table outlines the primary differences, but the real value lies in understanding where each method performs best in practice.
LiDAR is ideal for projects in complex environments where speed and precision are essential. Its ability to penetrate vegetation gives it a clear advantage in forestry or areas with dense foliage. On the other hand, photogrammetry shines when detailed visual documentation is required, such as capturing the intricate textures of buildings, infrastructure, or open landscapes unobstructed by heavy vegetation.
While LiDAR offers faster data collection and processing, it comes with higher hardware and operational costs. Photogrammetry, though slower and more resource-intensive during processing, provides highly detailed RGB-based 3D models at a lower overall cost.
Urban settings with clear sightlines often favor photogrammetry due to its ability to capture fine architectural details and surface textures. Conversely, LiDAR dominates in forested areas, where it can achieve ground modeling accuracy within a tenth of a foot, even under dense canopy cover.
Ultimately, the decision between LiDAR and photogrammetry depends on factors like project goals, budget, and environmental conditions. Many organizations find that combining the two technologies delivers the most comprehensive results. LiDAR can handle precise ground modeling, while photogrammetry adds rich visual detail for surface textures. Together, these tools can seamlessly integrate into digital twin workflows, offering a balanced approach to site documentation.
sbb-itb-ac6e058
Digital Twin Platform Integration
The real power of LiDAR and photogrammetry data comes to life when it’s integrated into a digital twin platform. Anvil Labs takes spatial data management, visualization, and collaboration to the next level by accommodating multiple data types and supporting seamless workflows. This integration lays the foundation for the platform's advanced capabilities.
Digital Twin Platform Features
Anvil Labs brings together a wide range of data types - LiDAR point clouds, photogrammetric 3D models, orthomosaics, 360° photos, and thermal imagery - into a single, unified workspace. This allows users to combine the precise geometry of LiDAR with the detailed visual elements of photogrammetry in one cohesive environment.
The platform’s data processing tools handle various file formats and optimize them for web-based visualization, eliminating the need for additional software. This ensures that everyone - from field teams to office staff and executives - has access to up-to-date data on any device. Secure sharing features allow users to control access to sensitive project information, enabling teams to share specific data layers or project areas with contractors, clients, or regulatory agencies without exposing the entire dataset. On top of this, integrated workflows simplify site documentation processes.
Site Documentation Workflow Optimization
By embedding annotation and measurement tools directly into the platform, Anvil Labs streamlines documentation tasks that would otherwise require multiple applications. The Point Inspector tool is a standout feature, letting users "pinpoint any spot in 3D and get the exact 2D details". This bridges the divide between 3D spatial data and conventional 2D documentation needs.
The platform’s measurement tools work effortlessly across both LiDAR and photogrammetric datasets. By combining LiDAR’s precise measurements - often achieving vertical accuracy within 2 centimeters - with photogrammetry’s detailed visual context, the platform greatly improves documentation accuracy. For instance, LiDAR data is ideal for structural assessments, while photogrammetry excels in providing surface texture and visual details. Team members can annotate specific points directly on 3D models, creating markers that stay linked to exact spatial coordinates and sync automatically across devices.
Anvil Labs doesn’t stop at internal workflows. Its integration capabilities extend to external tools like Matterport, YouTube, AI analysis systems, and task management platforms. These connections enable automated workflows - for example, spatial data can trigger actions in other systems, such as generating maintenance tickets when thermal imagery detects equipment anomalies.
Data Collection Best Practices
Getting the best results from LiDAR and photogrammetry projects comes down to following well-established protocols. Careful planning, quality checks, and attention to detail during operations can make the difference between a smooth project and costly setbacks.
Pre-Mission Preparation
The foundation of quality data lies in a well-defined project scope, a clear understanding of the area to be mapped, and specific detail requirements. Choosing the right location is just as important - factors like accessibility, restricted airspace, and potential obstacles must be considered. Operators also need to ensure they have the necessary airspace permissions for flight authorization.
Weather plays a critical role in data collection. Calm, clear days with minimal wind and good lighting are ideal. Conditions like rain, fog, or strong winds can interfere with sensor performance, so these should be avoided. Equipment preparation is equally vital: ensure all drones and sensors are fully charged, calibrated, updated, and backed up before heading out.
For LiDAR-specific operations, keeping the sensor clean is essential. Use proper cleaning materials to remove dirt or fingerprints before flight. Flight path planning is another key step - this involves setting pre-programmed waypoints, altitude levels, and overlap ratios using photogrammetry software like DJI GS Pro or Pix4Dcapture to ensure full coverage. Additionally, LiDAR projects require precise base station setup. This includes enabling all satellite constellations (GPS, GLONASS, Beidou, Galileo), recording pole height and ARP-APC offsets accurately, and starting data logging at least five minutes before takeoff - and continuing for five minutes after landing.
Once pre-flight preparations are complete, focus shifts to ensuring the data collected is processed and validated effectively.
Post-Processing and Quality Assurance
Raw data is only the beginning; post-processing transforms it into usable insights. Quality assurance starts immediately after collection and involves checks for accuracy and completeness. For photogrammetry, this includes verifying ground control points and assessing image overlap, while LiDAR surveys require analyzing point cloud density. Routine calibration checks ensure sensors maintain accuracy throughout the project.
Operator Training and Skill Development
No matter how thorough the planning or advanced the technology, skilled operators are the backbone of successful data collection. The growing commercial drone market - spanning industries like agriculture, construction, infrastructure inspection, and logistics - has created strong demand for trained operators. With surveying technicians earning a median salary of $50,290 and a projected 16% growth rate in the field, ongoing training is critical for both career growth and data quality improvement.
Training programs vary widely, from online courses to in-depth academies. For example, Candrone Academy offers courses like Aerial LiDAR Fundamentals for $600 and Advanced LiDAR Processing for $1,050. For those looking for comprehensive training, programs like the Drone Pilot Industrial Applications Training Program cost $35,000.
Key skills for UAV operators fall into two main categories:
| Skill Category | Specific Skills |
|---|---|
| Technical Skills | FAA Part 107 Regulations, Airspace Management, UAV Flight Operations, Payload Operation, Data Acquisition, Battery Management |
| Soft Skills | Attention to Detail, Situational Awareness, Problem-Solving, Adaptability, Communication, Decision-Making Under Pressure |
To stay ahead, operators should focus on advanced sensor operation, data processing, BVLOS procedures, photogrammetry, and staying compliant with regulations. Beyond formal training, hands-on experience and specialized certifications are invaluable for honing expertise. Skilled operators not only ensure precise data collection but also help integrate data into digital twin platforms, boosting overall project efficiency. Networking and mentorship opportunities can further accelerate professional growth and keep operators aligned with industry advancements.
Conclusion
The choice between LiDAR and photogrammetry largely depends on the specific needs of your project. As Matterport aptly puts it:
"Choosing the right 3D scanning method can make or break a project. Pick wrong, and you might end up with slow processing, incomplete data, or the wrong tool for your environment".
LiDAR stands out for its exceptional precision, offering millimeter-level accuracy even in challenging conditions like low light or uneven terrain. However, this level of accuracy comes with a hefty price tag.
On the other hand, photogrammetry provides a more affordable solution while delivering visually detailed results. For instance, in urban settings, photogrammetry can maintain object dimensions with deviations of less than 6% compared to actual measurements. This affordability makes it an attractive option, especially when compared to LiDAR’s premium costs, paving the way for hybrid approaches.
By combining these technologies, it's possible to create point clouds that are both visually detailed and spatially accurate. This reduces errors and ensures structural integrity, with machine learning further enhancing the quality and efficiency of the results.
Platforms like Anvil Labs make this integration process straightforward. Supporting a variety of data types - such as LiDAR point clouds, orthomosaics, thermal imagery, and 3D models - Anvil Labs enables teams to merge datasets into detailed digital twins. This capability is especially valuable for industrial applications, where both geometric accuracy and visual context are vital for thorough site documentation and analysis.
Whether you opt for LiDAR’s precision, photogrammetry’s affordability, or a blend of both, success depends on adhering to rigorous protocols and using a robust platform to manage and visualize your data effectively.
FAQs
What factors should you consider when choosing between LiDAR and photogrammetry for your project?
When choosing between LiDAR and photogrammetry, the decision largely hinges on the unique demands of your project. Here are some key points to weigh:
- Precision: If your project demands extremely accurate measurements or detailed modeling, LiDAR delivers the high-level precision you’ll need.
- Lighting requirements: LiDAR shines in low-light or nighttime conditions, while photogrammetry depends on good lighting and high-quality images to produce reliable results.
- Handling complex surfaces: For capturing intricate or uneven surfaces - think dense forests or rugged landscapes - LiDAR is the better option.
- Budget and ease of use: Photogrammetry tends to be more budget-friendly and easier to deploy, though it might require additional time for processing the data.
The best method will ultimately depend on factors like your project’s objectives, financial constraints, and the environment you’re working in. To manage and analyze 3D data from either technique, tools like Anvil Labs provide powerful solutions for processing, sharing, and hosting spatial data to fit your requirements.
How do weather conditions affect the accuracy of LiDAR and photogrammetry data collection?
Weather plays a big role in the accuracy of data collected through LiDAR and photogrammetry. For LiDAR, elements like rain, fog, or snow can interfere with laser signals. Water droplets and snowflakes scatter or absorb the lasers, which can lead to gaps in the data or less precise results. On the other hand, photogrammetry depends on clear visibility and adequate lighting. Conditions like fog or poor light can distort captured images, reduce clarity, and ultimately affect the quality of the data.
For the most reliable outcomes, it’s crucial to schedule data collection when the weather is favorable, minimizing disruptions caused by these environmental factors.
What are the advantages of combining LiDAR and photogrammetry data in a digital twin for industrial use?
Integrating LiDAR and photogrammetry data into a digital twin offers a powerful advantage for industrial applications. LiDAR excels in delivering precise 3D geometry and can even penetrate vegetation, making it an excellent choice for accurate mapping and measurement tasks. Meanwhile, photogrammetry provides detailed textures and vibrant colors at a lower cost, adding rich visual detail to the model.
When these technologies are combined, they create a more comprehensive and detailed representation of the environment. This blend enhances visualization, supports deeper analysis, and improves decision-making processes, leading to better operational insights and more streamlined site management.
