Drones are transforming industrial inspections by making them safer, faster, and more cost-effective. Industries like energy, construction, and mining are using drones to reduce costs by up to 90% and cut inspection times by 70-90%. For example, BP saved $2.5 million in 2022 by inspecting 1,200 miles of pipelines with drones. Similarly, Duke Energy reduced safety incidents by 40% and inspection times by 90% in 2023.
Here’s how you can optimize your inspection processes with drones in five steps:
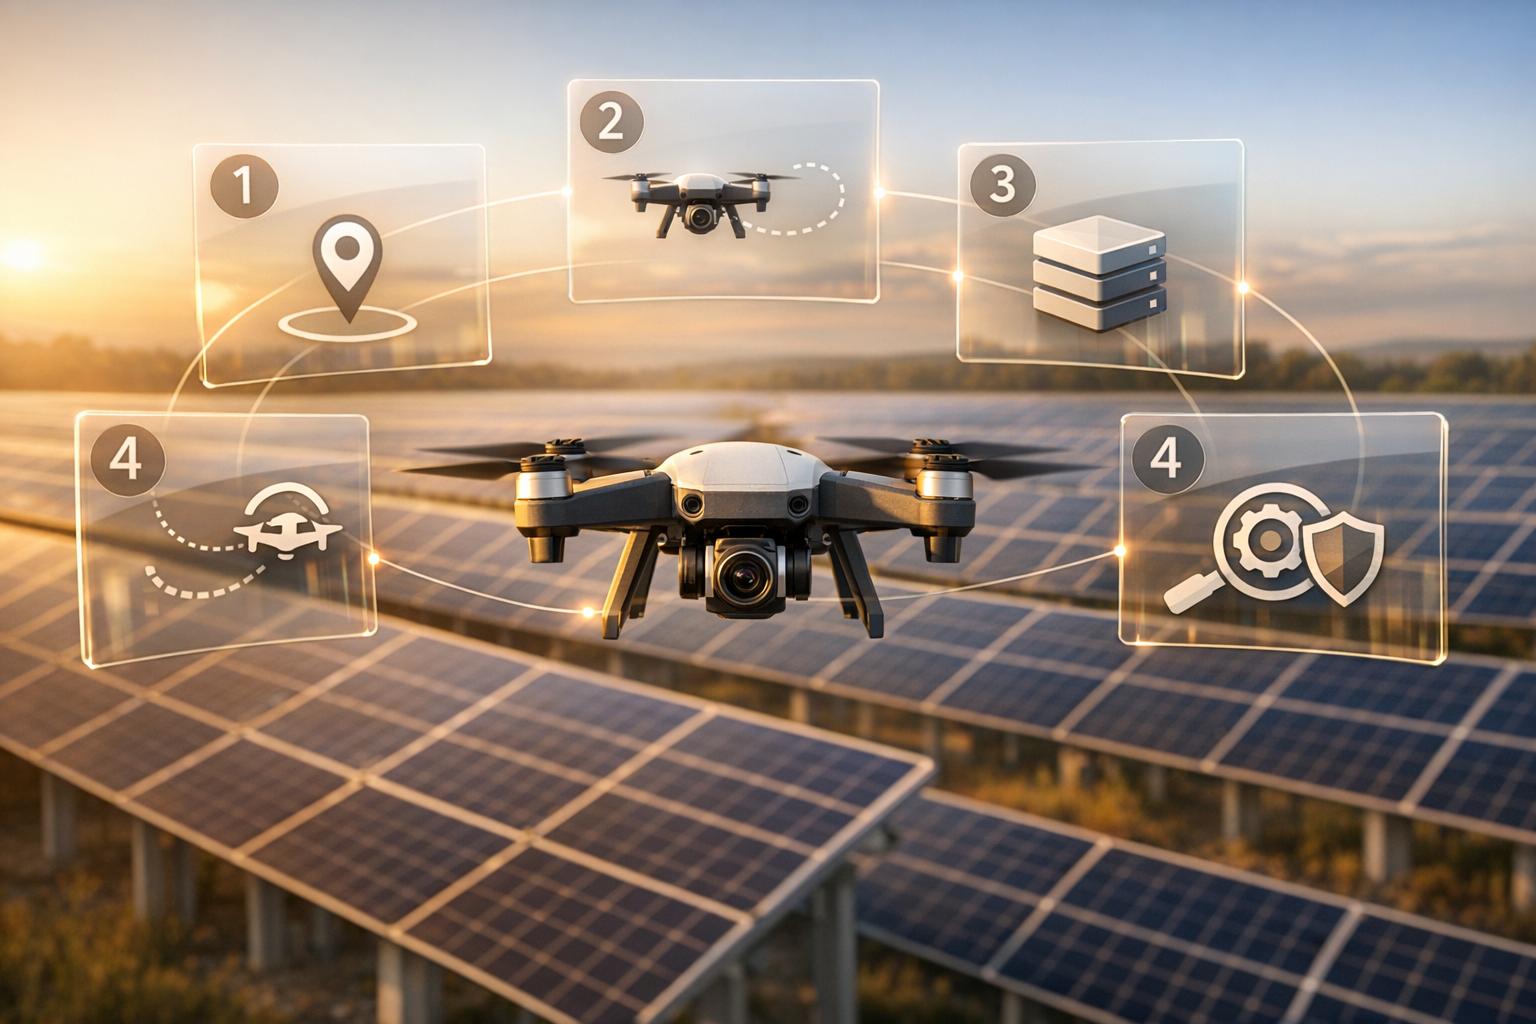
- Set Clear Goals and Plan Drone Missions: Define inspection objectives, select the right sensors (e.g., thermal, LiDAR), and design safe, efficient flight paths.
- Collect Quality Data: Calibrate drones properly, use multiple sensors for detailed insights, and ensure data accuracy with tools like LiDAR and thermal imaging.
- Process and Store Data Centrally: Convert raw data into usable formats like 3D models and orthomosaics, and store securely on cloud platforms for easy access.
- Analyze and Annotate: Use spatial tools to mark defects, measure dimensions, and track changes, enabling faster, more accurate decision-making.
- Automate Workflows and Share Data: Integrate data with task management systems to assign work automatically and control data sharing with secure access permissions.
By following these steps, companies can reduce inspection times, improve data precision, and enhance safety - while cutting costs significantly. For instance, Pacific Gas and Electric saved $1.2 million in 2024 using drone data to manage vegetation encroachments.
Drones are not just tools - they’re reshaping how inspections are done, delivering better results across industries.

5-Step Drone Inspection Workflow Optimization Process
Step 1: Set Inspection Goals and Plan Drone Missions
Define Your Inspection Goals
Before launching a drone, it’s essential to know exactly what you’re inspecting and why. Are you looking for cracks in concrete structures, signs of corrosion on storage tanks, or creating a detailed map of an entire facility? Each of these goals requires specific sensors, flight settings, and data outputs.
Start by identifying the assets you’ll focus on - like pipelines, building facades, or electrical systems - and the type of issues you’re aiming to detect. For structural inspections, you might look for corrosion, cracks, or material wear. For electrical systems, thermal imaging can help spot components overheating before they fail. Choosing the right sensor is critical: high-resolution cameras are great for spotting visual defects, thermal sensors detect heat anomalies, and LiDAR excels at producing accurate 3D maps. Interestingly, 80–90% of inspections reveal no immediate maintenance needs, cutting down on expensive scaffolding and manual checks.
Once you’ve nailed down your objectives and sensor requirements, it’s time to plan your flight paths.
Plan Your Drone Flights
With your goals set, the next step is designing drone missions that efficiently gather the data you need. Start by surveying the site to identify potential hazards - like cranes, power lines, or other obstacles - that could endanger your equipment or personnel. A thorough survey ensures safe operations and complete data collection.
Flight parameters play a huge role in the quality of your data. Flying at lower altitudes provides better resolution for spotting small defects, while maintaining an image overlap of 70–80% is crucial for accurate 3D modeling. For large areas, grid patterns work best, while following the contours of specific structures - like pipelines or jetties - ensures no detail is missed.
Professional-grade inspection drones, which cost between $10,000 and $50,000 depending on their sensor configurations, can cut data collection time dramatically - from hours to just 5–20 minutes. To avoid unnecessary delays, always have spare batteries, propellers, and sensors on hand, especially when working in high-demand industrial settings.
sbb-itb-ac6e058
Step 2: Collect High-Quality Drone Data
Calibrate Your Equipment
Calibration is a crucial step before every flight. Without it, you risk positional errors of 5–10% and flight path drifts of up to 2 meters within just 10 minutes. This can jeopardize both safety and the accuracy of your data. Start by calibrating the IMU on a flat, metal-free surface - this process typically takes 30–60 seconds and should follow the manufacturer’s instructions. Next, calibrate the compass using the recommended figure-eight rotation method. For accurate georeferencing, ensure your GPS connects to at least 10–15 satellites before taking off.
Before launching, test the alignment of your camera or sensors, make sure batteries are fully charged, and inspect the propellers for any damage. Environmental factors, like magnetic interference, temperature shifts exceeding 20°F, or recent firmware updates, may require recalibration. Neglecting this step could lead to a 3–5% drift in your data. To further improve data quality, manually adjust camera settings - such as exposure, focus, and resolution - rather than relying on auto-modes. For specialized sensors, like LiDAR, select the most suitable scanning modes to match your project needs.
Once your equipment is properly calibrated, you’re ready to capture diverse, high-quality data.
Collect Multiple Data Types
Gathering multiple data types in a single flight provides richer insights that a single sensor alone cannot achieve. For instance, RGB photography captures detailed visuals, while thermal imagery identifies heat anomalies as high as 1,000°F. LiDAR offers precise 3D measurements with ±2 cm accuracy and can even penetrate vegetation, making it ideal for topographic mapping. Orthomosaics, on the other hand, create scaled maps with a resolution of 1:500, enabling centimeter-level detection of changes over time.
This multi-sensor approach not only reduces false negatives by 40–50%, as shown in expert studies, but also supports predictive maintenance. For example, it can help identify early signs of issues like moisture ingress or corrosion before they become major problems. Platforms like Anvil Labs allow you to integrate data from thermal, LiDAR, and RGB sensors for advanced spatial analysis. By overlaying thermal imagery onto 3D models, you can pinpoint complex issues with precision. In fact, using this data fusion method for building audits has shown efficiency improvements of 20–30%.
End-to-End Visual & Thermal Roof Inspections | Drone Mapping | Hammer Missions
Step 3: Process and Store Data on a Central Platform
Once you've captured high-quality data, the next step is to process it into formats that can drive actionable insights.
Convert Raw Data into Usable Formats
After completing a mission, raw drone imagery and sensor scans must be transformed into formats that are ready for analysis. This involves creating 3D models, point clouds, and orthomosaics - key tools for inspections. Software like Pix4Dmapper, Agisoft Metashape, and RealityCapture uses photogrammetry to combine overlapping images, producing dense point clouds that are then converted into textured 3D models. For LiDAR data, applications such as CloudCompare help refine raw scans into highly accurate point clouds.
Here’s an example: In 2022, a utility company processed over 10,000 acres of transmission line inspections using a cloud-based platform. This approach converted raw data into orthomosaics and 3D models in less than 24 hours per mission - much faster than the traditional 3–5 day manual process. The result? A 35% reduction in vegetation management costs, saving around $1.2 million annually, while identifying over 450 potential hazards before they caused issues. Another utility, led by GIS Manager Tom Reilly, processed drone LiDAR and photogrammetry data for 500 miles of power lines. Their point clouds achieved 5 cm accuracy, cutting analysis time by half - from two weeks to one week per corridor - and preventing outages valued at $800,000.
To ensure accuracy, maintain 80% image overlap during flights, use ground control points (GCPs) to achieve sub-centimeter precision, and confirm that GPS tags are correctly embedded. Tools like Anvil Labs simplify this workflow, converting thermal imagery, LiDAR, and RGB photos into actionable formats and integrating seamlessly with platforms like Matterport. Efficient processing not only ensures accurate analysis but also facilitates secure sharing in later stages.
Store and Manage Data Securely
Once your data is processed, storing it on a central platform is crucial for organization and accessibility. Cloud-based systems allow for real-time collaboration, automatic backups, and scalable storage for large datasets - some point clouds can reach several gigabytes. Compared to desktop-only workflows, centralized platforms can reduce data processing times by 40–60%. Additionally, 85% of infrastructure firms recognize secure central storage as essential for meeting regulatory requirements and maintaining audit trails.
Anvil Labs provides robust hosting solutions for 3D models, 360° photos, thermal imagery, LiDAR, and orthomosaics. Their platform includes customizable viewing options and cross-device accessibility, allowing users to add annotations, take precise measurements in feet and inches, and control data access with role-based permissions. Secure sharing links with expiration dates, SOC 2 compliance, and detailed audit logs ensure that your data remains protected while being accessible to inspectors, contractors, and other stakeholders. This secure, organized storage forms the backbone for automating workflows in future steps.
Step 4: Analyze and Annotate with Spatial Tools
Once your data is centrally stored and processed, spatial analysis takes center stage, turning raw models into actionable insights. This step involves using spatial tools to mark defects, measure dimensions, and track changes over time, making your data more meaningful and ready for decision-making.
Add Annotations and Measurements
With modern tools, you can annotate 3D models, LiDAR point clouds, and thermal imagery directly - no need to switch between applications. This allows you to mark defects, take precise measurements, and attach timestamped notes for team-wide collaboration. Color-coded tags (red for critical, yellow for caution, and green for routine) help prioritize tasks at a glance.
Anvil Labs offers annotation and measurement features compatible with various data types, including 3D models, 360° photos, thermal imagery, LiDAR, and orthomosaics. Inspectors can draw accurate measurement lines, add detailed notes, and overlay thermal data on 3D models to identify hotspots. For example, during oil rig inspections, teams can annotate thermal imagery to calculate heat loss areas in square feet, justifying preventive maintenance investments, which can sometimes exceed $50,000 per site. Similarly, bridge inspectors can annotate LiDAR models to measure void depths in spalling concrete - up to 4 inches - reducing manual site visits by 40% and prioritizing repairs.
Research shows that teams using annotation platforms can cut analysis time by 60% - from 20 hours to just 8 hours per site - while improving defect detection accuracy to 95% through measurable insights. Thermal imagery annotations alone reveal 30% more subsurface defects compared to visual inspections[ASCE Journal of Infrastructure Systems, Q1 2025]. To achieve this level of precision, calibrate scale references using drone metadata, leverage multi-angle views for 3D accuracy (keeping error rates under 1% on orthomosaics), and validate measurements against ground truth data.
These annotations lay the foundation for tracking changes over time and generating comprehensive reports.
Monitor Changes and Create Reports
Annotations are just the beginning. The next step is to monitor changes over time by comparing sequential drone captures. Spatial platforms enable you to overlay time-series data, such as orthomosaics from different inspections, to identify degradation patterns. Side-by-side 3D views and automated difference maps simplify the process, eliminating the need to manually sift through raw files from multiple missions.
Annotated models can be exported as templated PDFs, including measurements, change logs, and visuals for compliance purposes. For instance, a pipeline corrosion report might feature before-and-after images, quantified degradation rates (e.g., 0.1 inches per year), and recommended actions - all formatted in imperial units to meet U.S. regulatory standards. Anvil Labs even integrates with task management systems to auto-generate work orders from annotations, streamlining the process from detection to action. Companies using 3D annotation platforms report a 45% faster time-to-insight for maintenance decisions[Gartner Drone Analytics Report, 2025], reducing repeat inspections by 25%.
A great example comes from Pacific Gas and Electric (PG&E), which utilized DroneDeploy's spatial tools in Q2 2024 to annotate LiDAR data from over 500 power line inspections. Under the leadership of Inspection Manager John Reyes, the team measured 1,245 vegetation encroachments with 0.5-inch accuracy, cutting outage risks by 28% and saving $1.2 million in manual surveys[DroneDeploy Case Study, 2024]. These kinds of annotations have consistently improved repair speeds and reduced costs across various industries.
Step 5: Automate Workflows and Share Data Securely
Once you've analyzed and annotated your drone data, the next step is to turn those insights into action. This involves automating workflows and ensuring secure data sharing, creating a seamless process from data capture to actionable results.
Automate Task Assignments
By integrating drone data with task management systems, you can eliminate manual processes and significantly speed up response times - sometimes by as much as 50%. For example, if thermal imaging identifies a hotspot or LiDAR detects a fault, automation rules can immediately generate work orders. These work orders include precise location details and metrics, automatically assigned to the right technician without needing human input. This kind of automation ensures maintenance resources are allocated efficiently.
Anvil Labs demonstrates the power of such integrations. For instance, during power line inspections, orthomosaic imagery from drones can identify vegetation encroachments. Automation then prioritizes these findings into tasks, complete with GPS coordinates and imagery links. What once took days of manual sorting can now be done in minutes. In industries like utilities and oil and gas, companies using automated drone data integration have seen outage response times drop by 40% and defect resolution speed up by 25%.
To measure the success of these systems, keep an eye on metrics like task completion time (aim for a 30–50% reduction), assignment error rates, and collaboration efficiency (e.g., share link usage). Many tools also come with built-in dashboards to help you monitor these performance indicators.
Once tasks are automated, the next priority is ensuring that sensitive data is shared securely.
Control Data Access and Sharing
With automation in place, maintaining secure data sharing becomes crucial to protect information integrity and meet regulatory requirements. By implementing precise access controls, you can prevent unauthorized access to sensitive data, reducing risks like data breaches - which cost industries an average of $4.45 million per incident in 2023. Role-based access controls are an effective solution: inspectors can edit data, managers can share findings, and stakeholders can have read-only access as needed.
Anvil Labs supports secure sharing by enforcing permissions at the folder or asset level. For external collaborators, you can use time-limited, password-protected links or guest portals to share specific assets, such as 3D models or detailed reports, without giving full platform access. Additionally, audit logs track all sharing activities, ensuring complete traceability and helping you maintain compliance rates at 100%.
This controlled sharing approach strikes a balance: it protects sensitive data while enabling the collaboration necessary to act on drone insights quickly and effectively.
Conclusion
Streamlining inspection workflows can be achieved in five steps: setting clear goals and planning missions, collecting high-quality data, processing and storing it centrally, analyzing with spatial tools, and automating workflows with secure sharing. Following this method has shown to transform inspection processes and deliver measurable results.
The effectiveness of these steps is backed by real-world examples. For instance, recent industry reports highlight that optimized drone workflows can reduce inspection times by up to 65%, significantly lower costs, and eliminate safety incidents. Take Duke Energy, for example: they achieved a 65% reduction in data processing time - cutting it from two weeks to just three days - while slashing costs by 50%. This saved them $450,000 across 50 sites. Using orthomosaics and thermal data, Senior Engineer Lisa Rivera's team improved predictive maintenance, boosting equipment uptime by 20% [Duke Energy Case Study, DroneDeploy Partnership, 2023]. Similarly, BP reported a 75% reduction in manual inspection hours at their North Sea oil platforms during Q2 2024, cutting inspection time from 120 to 30 hours per site. This translated to $1.2 million in annual savings, all while maintaining zero safety incidents over 12 months [BP Sustainability Report 2024].
The safety benefits are equally compelling. Drone-optimized workflows keep workers out of dangerous environments, like high-voltage lines or confined spaces, reducing accident risks by 80-90%. This means you’re not just saving money - you’re also protecting your team.
FAQs
What drone sensors do I need for my inspection type?
The type of sensor you need depends entirely on the kind of inspection you're conducting:
- Thermal or Infrared Cameras: Perfect for thermal analysis, these sensors help detect heat patterns and temperature variations.
- LiDAR: Ideal for 3D mapping and structural inspections, LiDAR provides detailed depth and spatial data.
- High-Resolution RGB Cameras: Best suited for visual inspections, these cameras capture sharp images for detailed analysis.
- GNSS Modules: Essential for precise geolocation, ensuring accurate positioning data.
No matter the sensor, proper calibration is key to collecting reliable and accurate data.
How do I ensure drone data is accurate enough for compliance?
To collect precise drone data that meets compliance standards, it's essential to stay on top of sensor calibration. Regularly adjust components like the IMU, compass, and payloads - such as LiDAR or thermal cameras - to prevent issues like positional drift or warped imagery. For large or uneven areas, Ground Control Points (GCPs) can significantly improve accuracy.
Make sure to plan flights during favorable conditions, and always check sensors after software updates or any physical impacts. These steps help ensure your data remains reliable and compliant.
How can I turn drone findings into work orders automatically?
To simplify work orders based on drone findings, connect your inspection data directly to your workflow management system. Platforms like Anvil Labs make this possible by enabling real-time data analysis and linking inspection results with asset management tools. By setting up workflows that automatically create work orders when anomalies or specific thresholds are identified, you can speed up response times and make maintenance operations more efficient.
