Orthomosaic maps are highly accurate aerial images used in industries like construction, mining, and land development. To ensure high-quality results, here’s what you need to know:
- Flight Height: Determines image detail (e.g., 200 ft = 1-inch/pixel resolution).
- Photo Overlap: Use 70-80% front overlap and 60-70% side overlap for seamless mapping.
- Flight Patterns: Choose single grid, double grid, or adaptive terrain patterns based on site layout.
- Pre-Flight Prep: Check site conditions, FAA regulations, and weather for safe operations.
- Data Review: Verify image quality and coverage immediately after the flight to avoid errors.
Careful planning saves time, reduces costs, and ensures precise mapping for your projects.
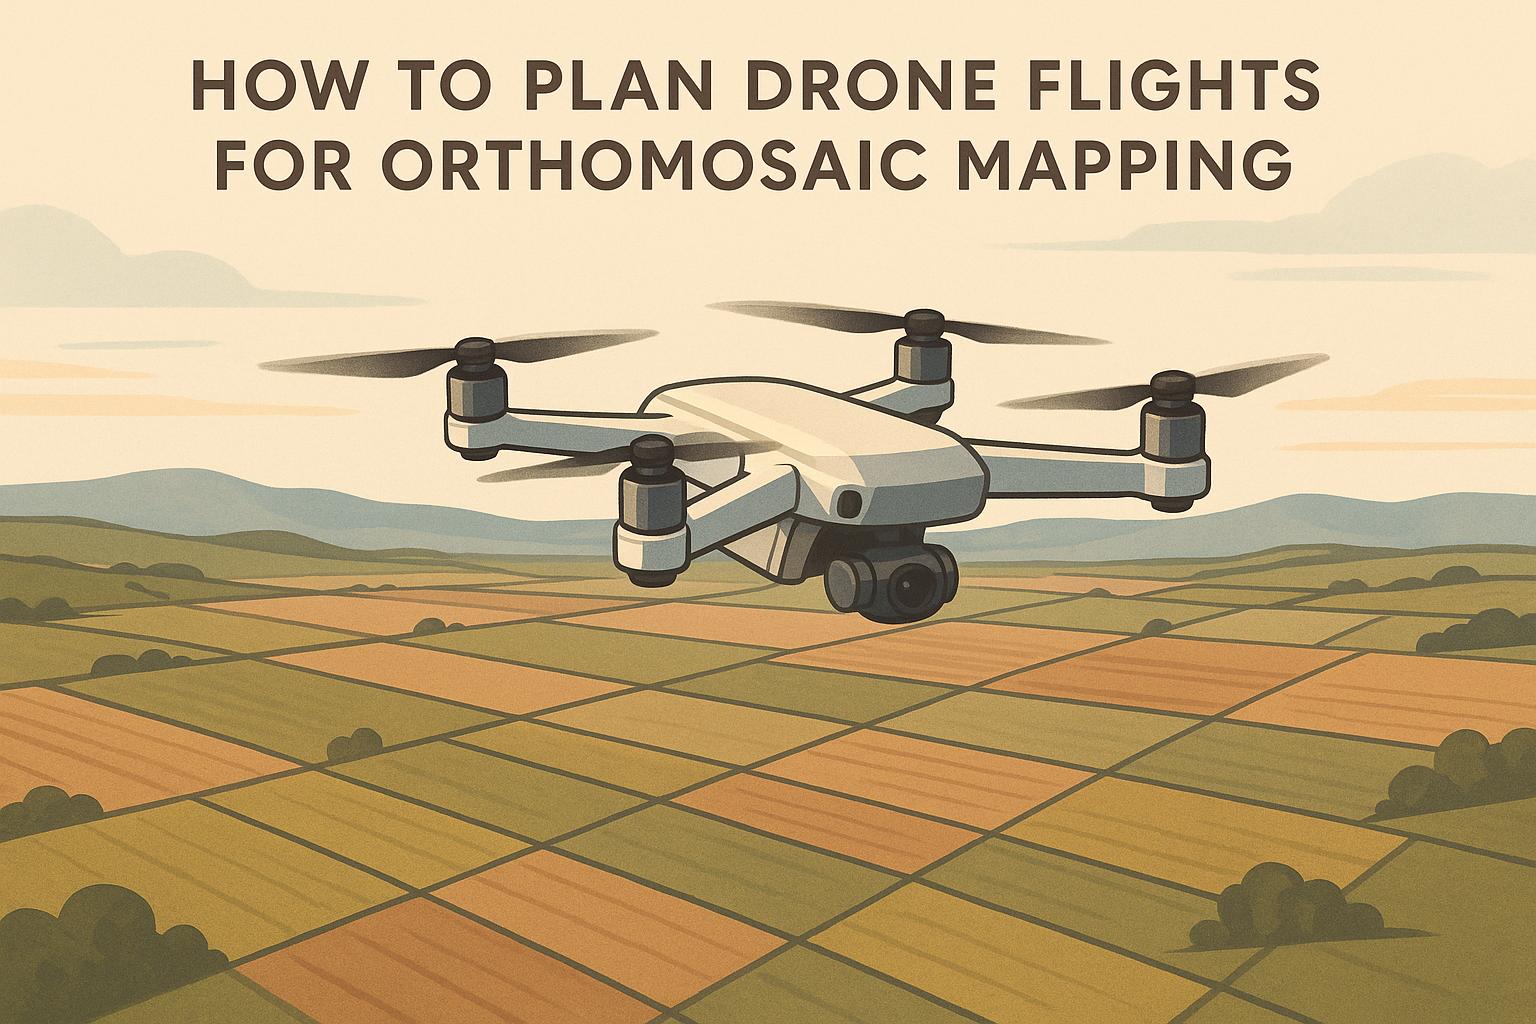
Ultimate Guide To Drone Mapping
Key Flight Planning Factors
Orthomosaic mapping relies on setting the right flight parameters.
Flight Height Setup
Flight height determines the Ground Sample Distance (GSD), or the size of each pixel. Flying lower gives you sharper detail but increases flight time and data storage needs.
| Flight Height (ft) | GSD (inches/pixel) | Ideal For |
|---|---|---|
| 100 | 0.5 | Infrastructure inspections |
| 200 | 1.0 | Monitoring construction sites |
| 400 | 2.0 | Mapping large terrains |
For most projects, flying between 200 and 400 feet strikes a good balance between resolution and area coverage.
Photo Overlap Settings
To create accurate orthomosaics, you need enough photo overlap. This helps photogrammetry software match features between images. Aim for:
- Front overlap (endlap): 70–80% between consecutive photos
- Side overlap (sidelap): 60–70% between parallel flight lines
These settings minimize gaps or distortions while keeping processing time and storage manageable. Once overlap is set, pick a flight pattern that fits your site.
Flight Pattern Types
Choose a flight pattern based on your site's layout:
- Single Grid Pattern: Best for flat, rectangular areas. Fly straight, parallel lines, aligning against the wind for better stability.
- Double Grid Pattern: Suited for areas with complex structures or varying elevations. Use a crosshatch pattern to capture multiple angles.
- Adaptive Terrain Pattern: Ideal for sites with significant elevation changes. Adjust the drone's altitude to keep a consistent height above the ground, ensuring uniform GSD.
Keep your drone speed between 10 and 15 mph to avoid motion blur.
Creating Your Flight Plan
Site Check Before Flying
Start by assessing the site. Use tools like a laser rangefinder or GPS to measure the target area. Look out for obstacles such as power lines, trees, or buildings, and make sure to review FAA airspace regulations for any necessary LAANC authorization. Walking the site can help you spot hazards and get a better sense of the terrain.
Setting Up Flight Routes
Plan your flight path using your drone's control software. Choose a flight pattern based on the site’s layout - a simple grid works well for flat areas, while uneven or complex terrain may need a custom pattern. Align your flight lines with the longest dimension of the site to cut down on turns and improve efficiency. Before locking in your routes, double-check the environmental conditions to ensure smooth operations.
Weather and Light Checks
Check the weather forecast, including wind, temperature, and cloud cover, to confirm it's safe to fly. Schedule flights for mid-morning to avoid harsh shadows, which can distort images. Steer clear of times like sunrise or sunset for the same reason. Once your plan is ready, upload it to your drone's control system and run through a final pre-flight checklist. Platforms like Anvil Labs can process and host your orthomosaic deliverables, making it simple to review and share results with your team.
sbb-itb-ac6e058
Data Collection and Quality
Flight Preparation Steps
Before taking off, conduct a thorough pre-flight inspection to ensure your equipment is ready for capturing high-quality data. Check critical systems like battery levels and GPS signal strength. Place reference points throughout your survey area to improve accuracy. During the flight, keep an eye on image quality to ensure everything is running smoothly.
Photo Quality Check
Use your control software to monitor image quality as you fly. Make sure photos are sharp, well-exposed, and cover the entire survey area. Clear and detailed images can set your results apart from the competition.
Data Review Process
Once the flight is complete, review your data immediately to confirm it meets the necessary standards for accurate orthomosaic mapping. Verify consistent image overlap and full area coverage. If you spot any gaps or errors, take additional images on-site to avoid the expense and hassle of returning later. Organize your data carefully to make processing easier and more efficient.
Using Anvil Labs for Mapping

Once your data is collected with a well-planned flight, Anvil Labs turns it into insights you can act on.
Map Upload and Analysis
Uploading your orthomosaic data to Anvil Labs is simple - just drag and drop. The platform supports both raw images and processed orthomosaics, offering over 20 processing options. Organizing your files properly ensures faster processing and better analysis results. From there, you can dive into tools designed to help you manage and analyze your site data effectively.
Site Management Features
With Anvil Labs, you can use measurement and annotation tools to analyze your site with precision. Mark areas, calculate distances, and measure surfaces - all with ease. Users have reported spotting 30% more defects compared to older methods.
"My overall experience with the software has been satisfying because of the efficient workflow. I would highly recommend other organizations to use your software simply because of how much value you get for what you pay for... The ROI is clearly marked within the first few uses."
- Angel Rojas, Red Angel Drones
Secure, password-protected data sharing makes team collaboration easy without compromising security. Plus, integrations with other platforms make your workflow even smoother.
Platform Connections
Anvil Labs works across devices, giving you access whether you're in the office or on-site. It also connects with Matterport for better visualization and YouTube for video sharing.
"This is a differentiator. Those that aren't able to provide visualization but are just doing raw footage - this gives you, in my opinion, that competitive edge."
- Adrian, Drone Service Provider
The platform supports a variety of data types to meet different needs:
| Data Type | Use Case |
|---|---|
| 360° Panoramas | Detailed site visualization |
| Thermal Imagery | Heat mapping and analysis |
| LiDAR Scans | Precise elevation mapping |
| Point Clouds | Detailed 3D visualization |
These tools make inspections up to 75% faster, simplifying the entire process from data collection to analysis.
Summary
Careful planning and advanced techniques lead to high-quality orthomosaic maps that provide useful insights. With proper preparation and precise execution, organizations have reported saving hundreds of thousands of dollars compared to traditional methods.
These savings also bring measurable improvements in operations, as shown below:
| Benefit | Impact |
|---|---|
| Improved Detection | 30% more defects identified |
| Simplified Workflow | Automated compliance checks and less rework |
| Data Integration | Handles various data types like thermal and LiDAR |
When paired with Anvil Labs, teams benefit from:
- Automated compliance checks
- Processing of multiple data formats
- Secure tools for team collaboration
- Access across different platforms
- Advanced visualization features
The success of orthomosaic mapping depends on careful planning and accurate execution, from setting up flights to analyzing the data.
FAQs
What is the best altitude to fly a drone for orthomosaic mapping?
The optimal altitude for drone flights in orthomosaic mapping depends on the level of detail required and the type of terrain you're mapping. Generally, flying at a height between 200 and 400 feet above ground level works well for most projects, as it balances image resolution and coverage area. However, always ensure your flight complies with local regulations and airspace restrictions.
For high-detail mapping, consider flying lower while increasing image overlap (typically 70-80% forward and side overlap) to ensure accuracy. Adjust your altitude based on the camera resolution, project requirements, and environmental factors like wind or obstacles.
How can I ensure proper photo overlap during drone flights for orthomosaic mapping?
To achieve high-quality photo overlap during drone flights, focus on consistent altitude, proper overlap settings, and a well-planned flight path. Generally, aim for at least 70% front overlap and 60% side overlap to ensure sufficient image coverage for accurate stitching.
Maintain a steady flight altitude and use a grid pattern for uniform coverage. Flying at a lower altitude can improve image detail but may require tighter overlap settings. Additionally, consider environmental factors like wind and lighting conditions to minimize disruptions during the flight.
How can I use Anvil Labs to better analyze and manage my orthomosaic data?
Anvil Labs provides a powerful platform designed to help you manage and analyze orthomosaic data with ease. Its features include asset hosting, data processing, and customizable viewing tools, allowing you to visualize and interact with your data effectively.
You can also use tools for annotations, measurements, and secure data sharing to collaborate seamlessly. The platform supports a wide range of data formats, including orthomosaics, 3D models, LiDAR, thermal imagery, and 360 photos, making it a versatile solution for managing industrial site data.
